33
/es/
AIzaSyAYiBZKx7MnpbEhh9jyipgxe19OcubqV5w
August 1, 2025
96048
Burundi
BDI
true
2
1
Exports of goods and services (constant LCU)
2016,2015,2014,2013,2012,2011,2010,2009,2008,2007,2006,2005,2004,2003,2002,2001,2000,1999,1998
Download
Estadísticas Globales de la Biblioteca →Burundi →

Exports of goods and services (constant LCU)

Estas estadísticas en otros países:

AlbaniaAlgeriaAngolaAntigua and BarbudaArgentinaArmeniaAustraliaAustriaAzerbaijanBahamas, TheBahrainBangladeshBarbadosBelarusBelgiumBelizeBeninBhutanBoliviaBosnia and HerzegovinaBotswanaBrazilBrunei DarussalamBulgariaBurkina FasoBurundiCabo VerdeCambodiaCameroonCanadaChadChileColombiaComorosCongo, Dem. Rep.Congo, Rep.Costa RicaCote d'IvoireCroatiaCubaCyprusCzech RepublicDenmarkDjiboutiDominican RepublicEcuadorEgypt, Arab Rep.El SalvadorEquatorial GuineaEritreaEstoniaEthiopiaFijiFinlandFranceGabonGambia, TheGeorgiaGermanyGhanaGreeceGuatemalaGuineaGuinea-BissauHaitiHondurasHong Kong SAR, ChinaHungaryIcelandIndiaIndonesiaIran, Islamic Rep.IrelandIsraelItalyJamaicaJapanJordanKazakhstanKenyaKorea, Rep.KosovoKuwaitKyrgyz RepublicLao PDRLatviaLebanonLiberiaLibyaLithuaniaLuxembourgMacao SAR, ChinaMacedonia, FYRMadagascarMalawiMalaysiaMaliMaltaMauritaniaMauritiusMexicoMoldovaMongoliaMontenegroMoroccoMozambiqueMyanmarNamibiaNepalNetherlandsNew ZealandNicaraguaNigerNigeriaNorwayOmanPakistanPanamaPapua New GuineaParaguayPeruPhilippinesPolandPortugalPuerto RicoQatarRomaniaRussian FederationRwandaSamoaSaudi ArabiaSenegalSerbiaSeychellesSierra LeoneSingaporeSlovak RepublicSloveniaSomaliaSouth AfricaSouth SudanSpainSri LankaSudanSurinameSwazilandSwedenSwitzerlandSyrian Arab RepublicTajikistanTanzaniaThailandTimor-LesteTogoTrinidad and TobagoTunisiaTurkeyTurkmenistanUgandaUkraineUnited Arab EmiratesUnited KingdomUnited StatesUruguayUzbekistanVanuatuVenezuela, RBVietnamWest Bank and GazaZambiaZimbabwe

línea de tiempo (timeline):

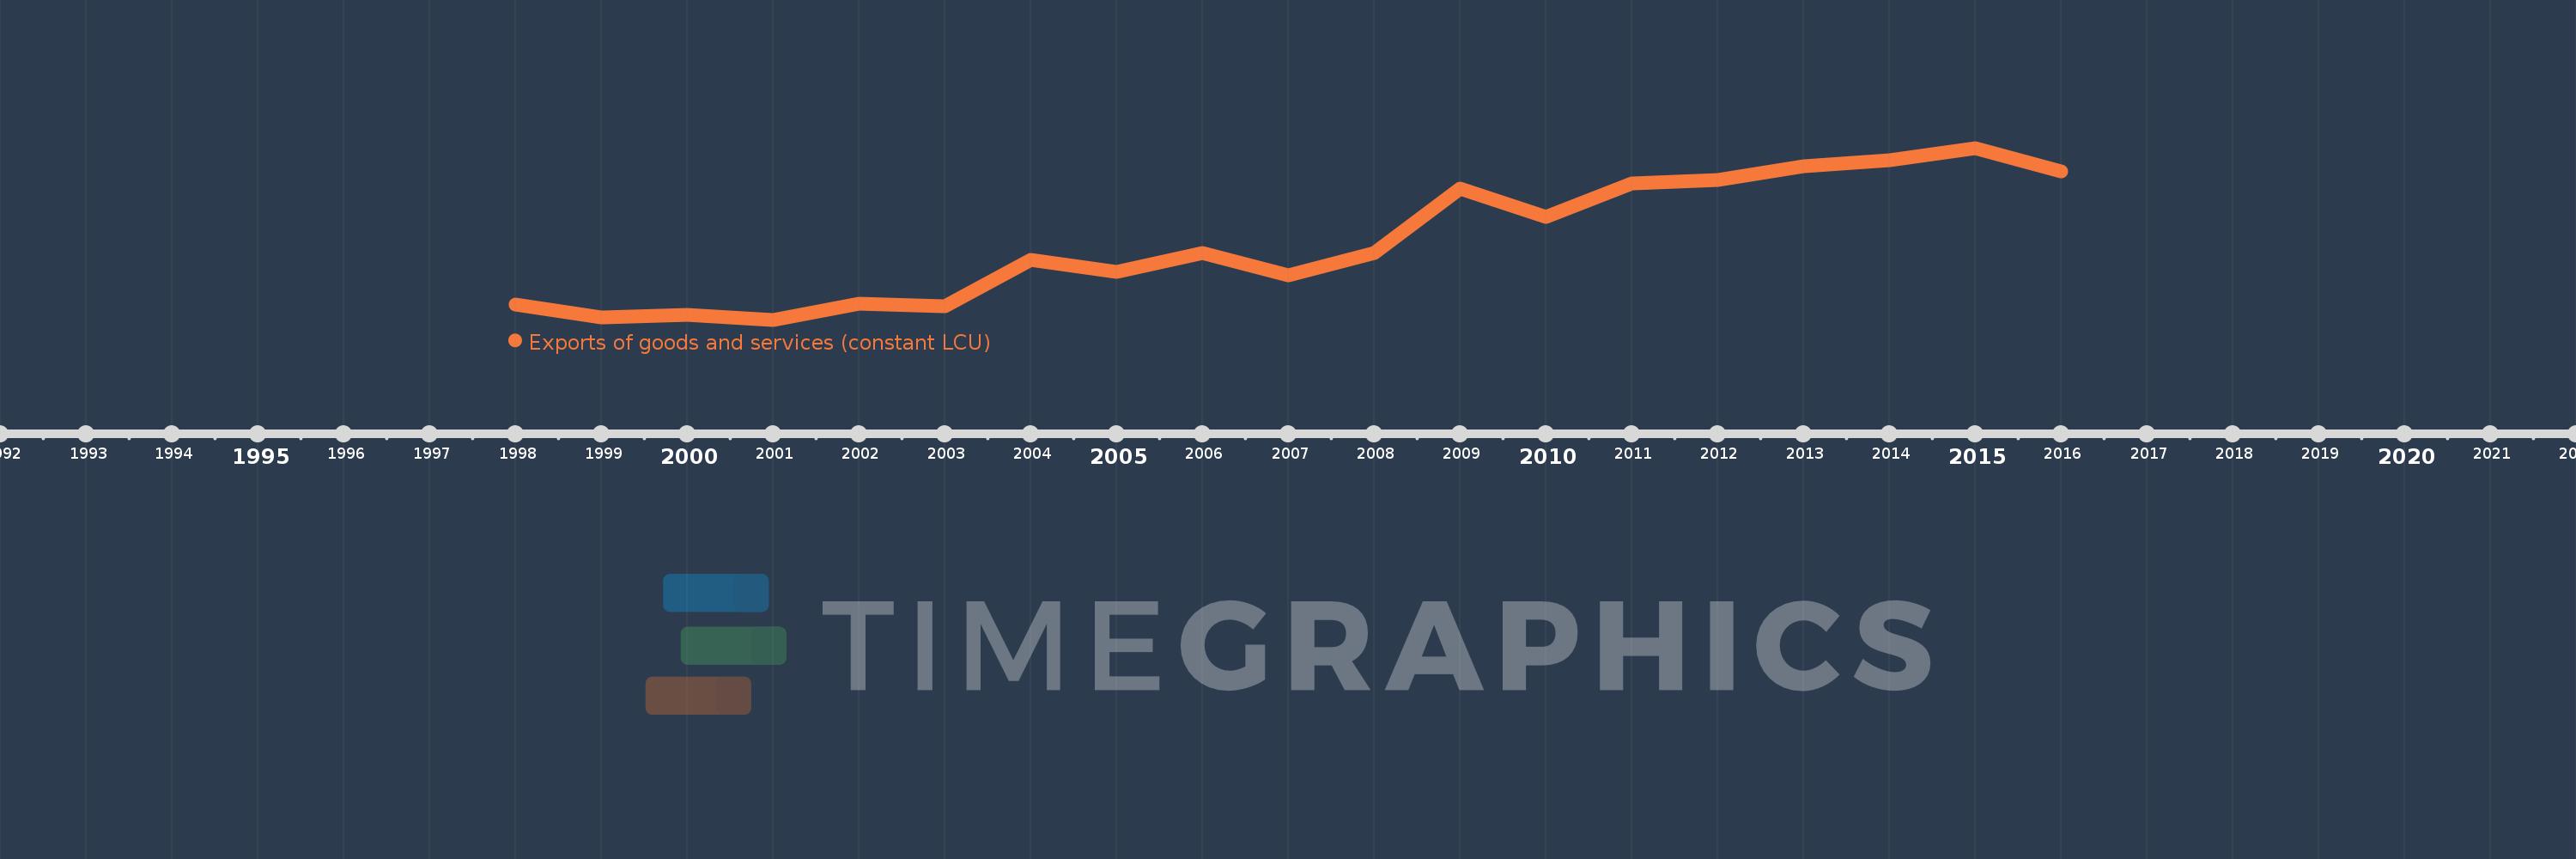
En esta escala de tiempo se presenta un gráfico de 1998 y 2016 de Burundi. Los datos de 1997 están ausentes. El número de observaciones reales por fecha: 19.

Fuente (nombre):

Indicadores del desarrollo mundial

Fuente (organización):

World Bank national accounts data, and OECD National Accounts data files.

Categorías:

Economy & Growth

Se ha actualizado:

23 abr 2017 año

Los indicadores de los cambios de valor en los últimos años

En promedio:
107.373 bn
Mínimo:
48.693 bn
1 ene 2001 año
Máximo:
178.0 bn
1 ene 2015 año
A la fecha de observación
Valor
Cambio absoluto
El cambio con respecto al valor anterior
1 ene 1998 año
59.9 bn
+59.9 bn
0.0%
1 ene 1999 año
50.5 bn
-9.4 bn
-15.69%
1 ene 2000 año
52.7 bn
+2.2 bn
4.36%
1 ene 2001 año
48.693 bn
-4.007 bn
-7.6%
1 ene 2002 año
61.063 bn
+12.37 bn
25.4%
1 ene 2003 año
58.532 bn
-2.531 bn
-4.14%
1 ene 2004 año
93.851 bn
+35.319 bn
60.34%
1 ene 2005 año
84.751 bn
-9.1 bn
-9.7%
1 ene 2006 año
99.119 bn
+14.368 bn
16.95%
1 ene 2007 año
82.07 bn
-17.049 bn
-17.2%
1 ene 2008 año
99.109 bn
+17.039 bn
20.76%
1 ene 2009 año
147.564 bn
+48.455 bn
48.89%
1 ene 2010 año
125.801 bn
-21.763 bn
-14.75%
1 ene 2011 año
151.244 bn
+25.443 bn
20.22%
1 ene 2012 año
153.889 bn
+2.645 bn
1.75%
1 ene 2013 año
164.0 bn
+10.111 bn
6.57%
1 ene 2014 año
168.92 bn
+4.92 bn
3.0%
1 ene 2015 año
178.0 bn
+9.08 bn
5.38%
1 ene 2016 año
160.378 bn
-17.622 bn
-9.9%

Ranking de los países por los datos estadísticos actuales