33
/es/
AIzaSyAYiBZKx7MnpbEhh9jyipgxe19OcubqV5w
August 1, 2025
114743
Croatia
HRV
true
2
1
Exports of goods and services (constant LCU)
2016,2015,2014,2013,2012,2011,2010,2009,2008,2007,2006,2005,2004,2003,2002,2001,2000,1999,1998,1997,1996
Download
Estadísticas Globales de la Biblioteca →Croatia →

Exports of goods and services (constant LCU)

Estas estadísticas en otros países:

AlbaniaAlgeriaAngolaAntigua and BarbudaArgentinaArmeniaAustraliaAustriaAzerbaijanBahamas, TheBahrainBangladeshBarbadosBelarusBelgiumBelizeBeninBhutanBoliviaBosnia and HerzegovinaBotswanaBrazilBrunei DarussalamBulgariaBurkina FasoBurundiCabo VerdeCambodiaCameroonCanadaChadChileColombiaComorosCongo, Dem. Rep.Congo, Rep.Costa RicaCote d'IvoireCroatiaCubaCyprusCzech RepublicDenmarkDjiboutiDominican RepublicEcuadorEgypt, Arab Rep.El SalvadorEquatorial GuineaEritreaEstoniaEthiopiaFijiFinlandFranceGabonGambia, TheGeorgiaGermanyGhanaGreeceGuatemalaGuineaGuinea-BissauHaitiHondurasHong Kong SAR, ChinaHungaryIcelandIndiaIndonesiaIran, Islamic Rep.IrelandIsraelItalyJamaicaJapanJordanKazakhstanKenyaKorea, Rep.KosovoKuwaitKyrgyz RepublicLao PDRLatviaLebanonLiberiaLibyaLithuaniaLuxembourgMacao SAR, ChinaMacedonia, FYRMadagascarMalawiMalaysiaMaliMaltaMauritaniaMauritiusMexicoMoldovaMongoliaMontenegroMoroccoMozambiqueMyanmarNamibiaNepalNetherlandsNew ZealandNicaraguaNigerNigeriaNorwayOmanPakistanPanamaPapua New GuineaParaguayPeruPhilippinesPolandPortugalPuerto RicoQatarRomaniaRussian FederationRwandaSamoaSaudi ArabiaSenegalSerbiaSeychellesSierra LeoneSingaporeSlovak RepublicSloveniaSomaliaSouth AfricaSouth SudanSpainSri LankaSudanSurinameSwazilandSwedenSwitzerlandSyrian Arab RepublicTajikistanTanzaniaThailandTimor-LesteTogoTrinidad and TobagoTunisiaTurkeyTurkmenistanUgandaUkraineUnited Arab EmiratesUnited KingdomUnited StatesUruguayUzbekistanVanuatuVenezuela, RBVietnamWest Bank and GazaZambiaZimbabwe

línea de tiempo (timeline):

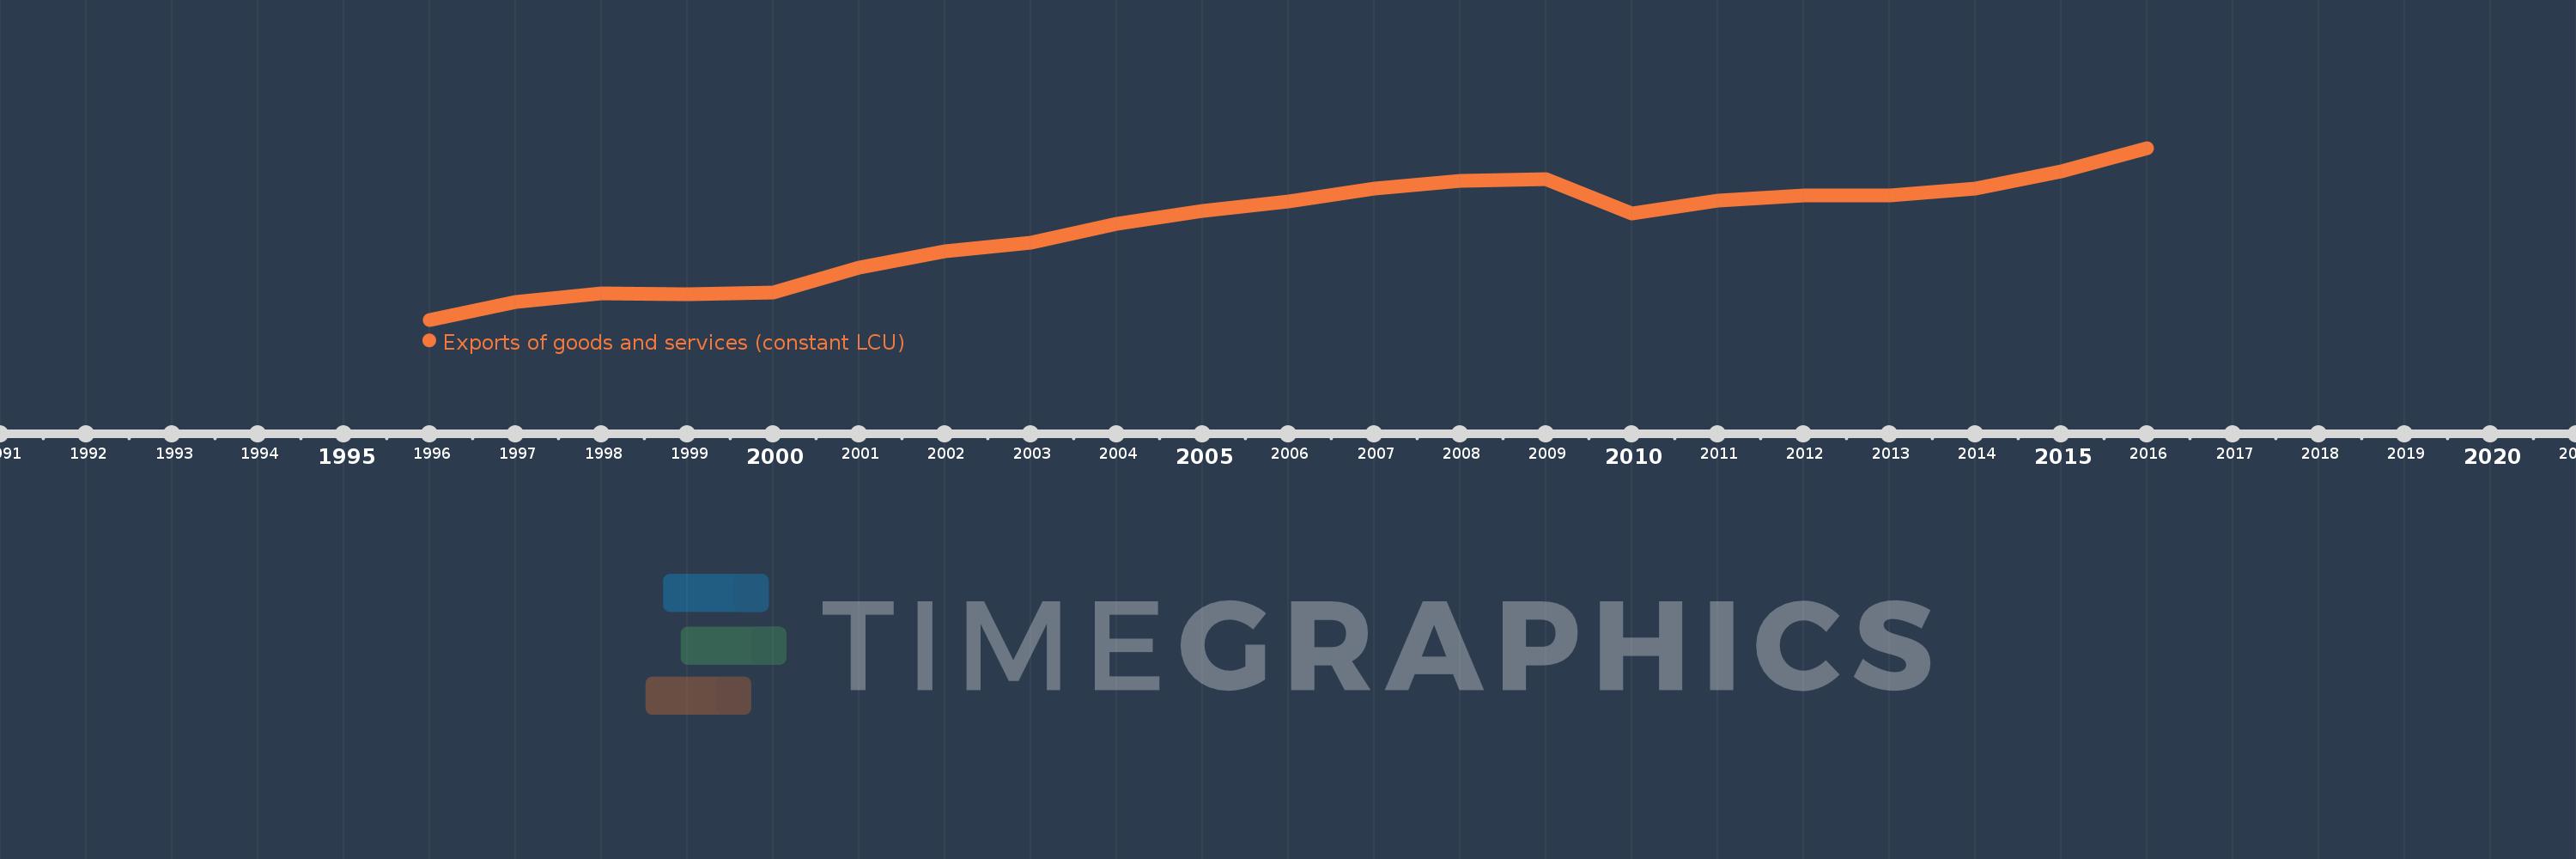
En esta escala de tiempo se presenta un gráfico de 1996 y 2016 de Croatia. Los datos de 1995 están ausentes. El número de observaciones reales por fecha: 21.

Fuente (nombre):

Indicadores del desarrollo mundial

Fuente (organización):

World Bank national accounts data, and OECD National Accounts data files.

Categorías:

Economy & Growth

Se ha actualizado:

23 abr 2017 año

Los indicadores de los cambios de valor en los últimos años

En promedio:
109.393 bn
Mínimo:
58.245 bn
1 ene 1996 año
Máximo:
152.701 bn
1 ene 2016 año
A la fecha de observación
Valor
Cambio absoluto
El cambio con respecto al valor anterior
1 ene 1996 año
58.245 bn
+58.245 bn
0.0%
1 ene 1997 año
67.999 bn
+9.754 bn
16.75%
1 ene 1998 año
72.551 bn
+4.553 bn
6.7%
1 ene 1999 año
72.394 bn
-157.788 millones
-0.22%
1 ene 2000 año
73.442 bn
+1.049 bn
1.45%
1 ene 2001 año
87.042 bn
+13.6 bn
18.52%
1 ene 2002 año
95.847 bn
+8.805 bn
10.12%
1 ene 2003 año
100.383 bn
+4.536 bn
4.73%
1 ene 2004 año
111.215 bn
+10.832 bn
10.79%
1 ene 2005 año
117.849 bn
+6.634 bn
5.97%
1 ene 2006 año
123.303 bn
+5.454 bn
4.63%
1 ene 2007 año
130.215 bn
+6.912 bn
5.61%
1 ene 2008 año
134.704 bn
+4.488 bn
3.45%
1 ene 2009 año
135.769 bn
+1.065 bn
0.79%
1 ene 2010 año
116.603 bn
-19.166 bn
-14.12%
1 ene 2011 año
123.794 bn
+7.191 bn
6.17%
1 ene 2012 año
126.578 bn
+2.784 bn
2.25%
1 ene 2013 año
126.396 bn
-182.77 millones
-0.14%
1 ene 2014 año
130.343 bn
+3.947 bn
3.12%
1 ene 2015 año
139.879 bn
+9.536 bn
7.32%
1 ene 2016 año
152.701 bn
+12.822 bn
9.17%

Ranking de los países por los datos estadísticos actuales