33
/es/
AIzaSyAYiBZKx7MnpbEhh9jyipgxe19OcubqV5w
August 1, 2025
237023
Serbia
SRB
true
2
1
Exports of goods and services (constant LCU)
2016,2015,2014,2013,2012,2011,2010,2009,2008,2007,2006,2005,2004,2003,2002,2001,2000,1999,1998,1997,1996
Download
Estadísticas Globales de la Biblioteca →Serbia →

Exports of goods and services (constant LCU)

Estas estadísticas en otros países:

AlbaniaAlgeriaAngolaAntigua and BarbudaArgentinaArmeniaAustraliaAustriaAzerbaijanBahamas, TheBahrainBangladeshBarbadosBelarusBelgiumBelizeBeninBhutanBoliviaBosnia and HerzegovinaBotswanaBrazilBrunei DarussalamBulgariaBurkina FasoBurundiCabo VerdeCambodiaCameroonCanadaChadChileColombiaComorosCongo, Dem. Rep.Congo, Rep.Costa RicaCote d'IvoireCroatiaCubaCyprusCzech RepublicDenmarkDjiboutiDominican RepublicEcuadorEgypt, Arab Rep.El SalvadorEquatorial GuineaEritreaEstoniaEthiopiaFijiFinlandFranceGabonGambia, TheGeorgiaGermanyGhanaGreeceGuatemalaGuineaGuinea-BissauHaitiHondurasHong Kong SAR, ChinaHungaryIcelandIndiaIndonesiaIran, Islamic Rep.IrelandIsraelItalyJamaicaJapanJordanKazakhstanKenyaKorea, Rep.KosovoKuwaitKyrgyz RepublicLao PDRLatviaLebanonLiberiaLibyaLithuaniaLuxembourgMacao SAR, ChinaMacedonia, FYRMadagascarMalawiMalaysiaMaliMaltaMauritaniaMauritiusMexicoMoldovaMongoliaMontenegroMoroccoMozambiqueMyanmarNamibiaNepalNetherlandsNew ZealandNicaraguaNigerNigeriaNorwayOmanPakistanPanamaPapua New GuineaParaguayPeruPhilippinesPolandPortugalPuerto RicoQatarRomaniaRussian FederationRwandaSamoaSaudi ArabiaSenegalSerbiaSeychellesSierra LeoneSingaporeSlovak RepublicSloveniaSomaliaSouth AfricaSouth SudanSpainSri LankaSudanSurinameSwazilandSwedenSwitzerlandSyrian Arab RepublicTajikistanTanzaniaThailandTimor-LesteTogoTrinidad and TobagoTunisiaTurkeyTurkmenistanUgandaUkraineUnited Arab EmiratesUnited KingdomUnited StatesUruguayUzbekistanVanuatuVenezuela, RBVietnamWest Bank and GazaZambiaZimbabwe

línea de tiempo (timeline):

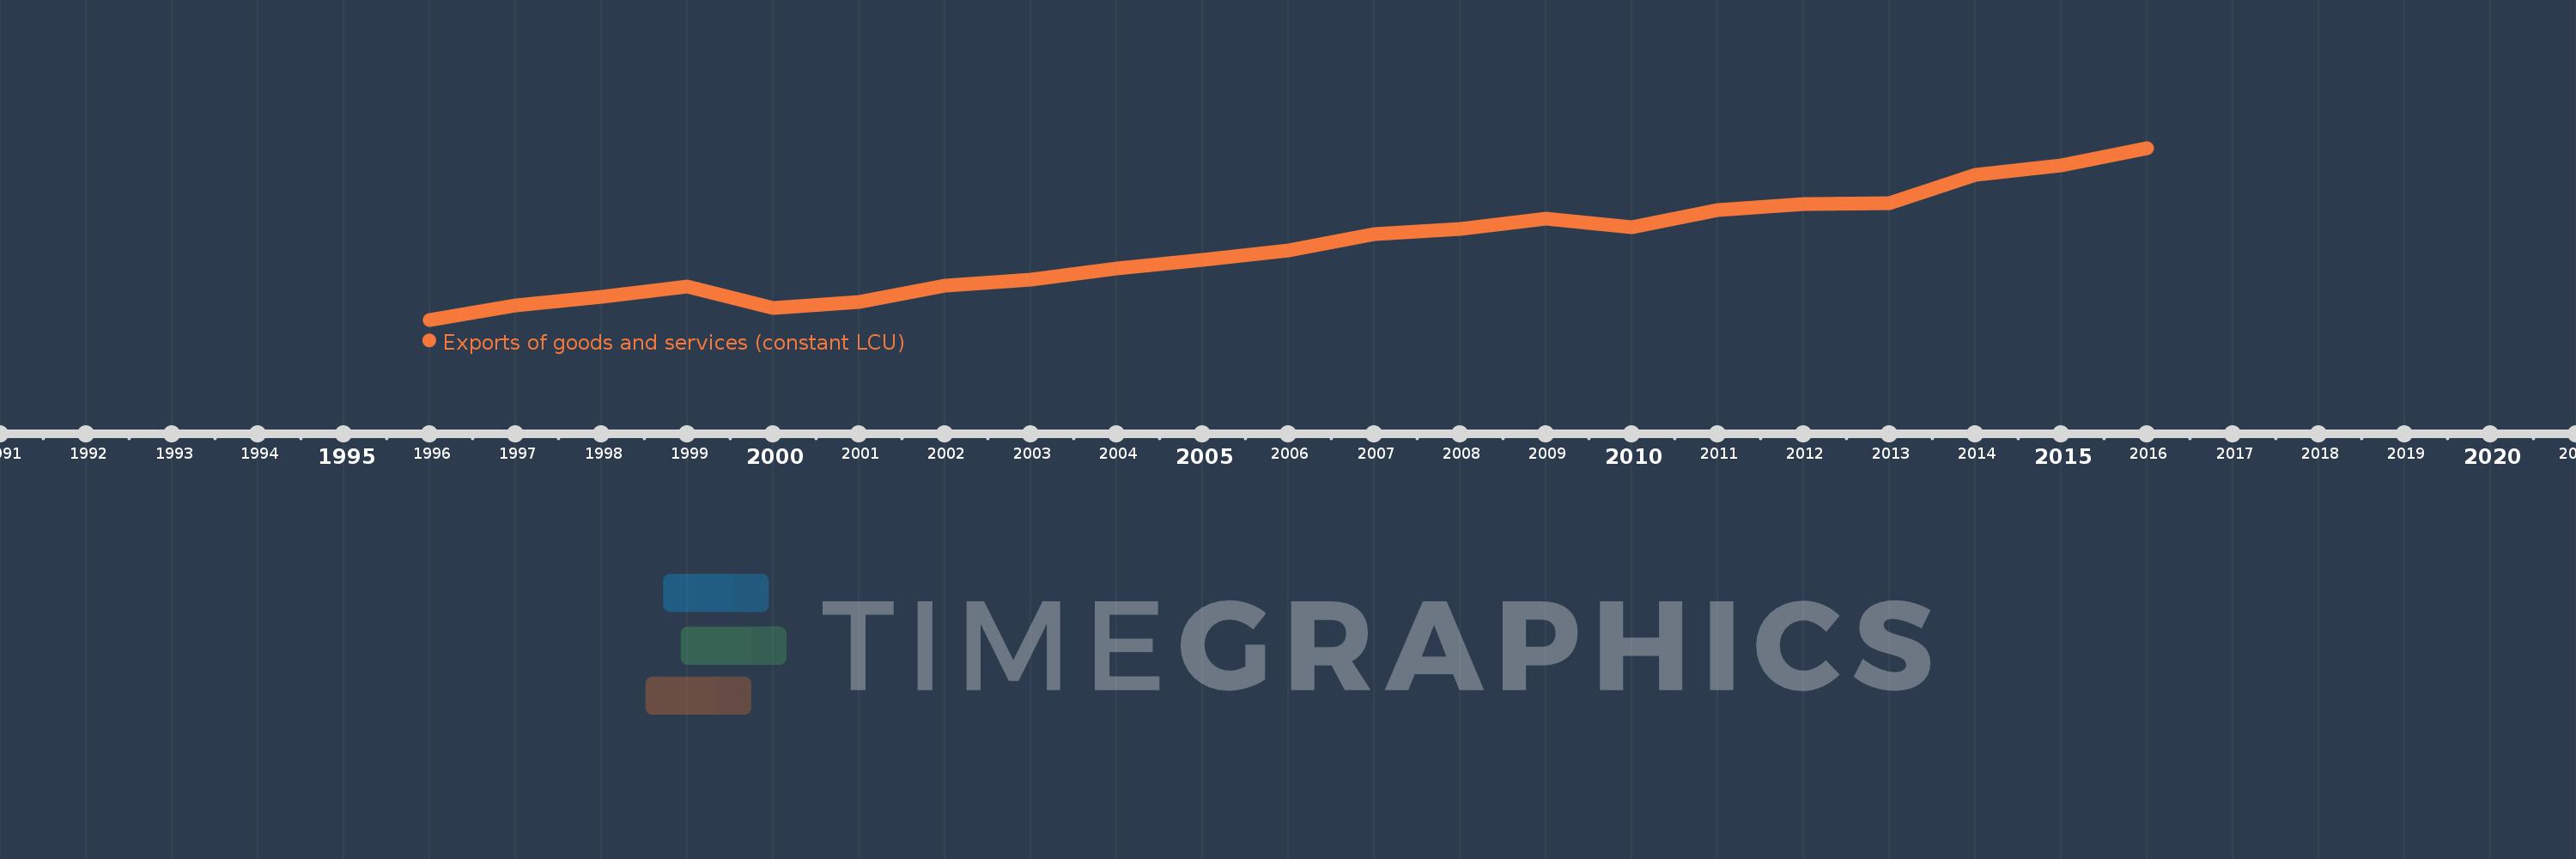
En esta escala de tiempo se presenta un gráfico de 1996 y 2016 de Serbia. Los datos de 1995 están ausentes. El número de observaciones reales por fecha: 21.

Fuente (nombre):

Indicadores del desarrollo mundial

Fuente (organización):

World Bank national accounts data, and OECD National Accounts data files.

Categorías:

Economy & Growth

Se ha actualizado:

23 abr 2017 año

Los indicadores de los cambios de valor en los últimos años

En promedio:
720.76 bn
Mínimo:
133.966 bn
1 ene 1996 año
Máximo:
1.51 billones
1 ene 2016 año
A la fecha de observación
Valor
Cambio absoluto
El cambio con respecto al valor anterior
1 ene 1996 año
133.966 bn
+133.966 bn
0.0%
1 ene 1997 año
247.323 bn
+113.357 bn
84.62%
1 ene 1998 año
318.027 bn
+70.704 bn
28.59%
1 ene 1999 año
400.965 bn
+82.938 bn
26.08%
1 ene 2000 año
227.207 bn
-173.758 bn
-43.33%
1 ene 2001 año
278.565 bn
+51.357 bn
22.6%
1 ene 2002 año
407.72 bn
+129.155 bn
46.36%
1 ene 2003 año
458.453 bn
+50.733 bn
12.44%
1 ene 2004 año
543.206 bn
+84.753 bn
18.49%
1 ene 2005 año
613.425 bn
+70.219 bn
12.93%
1 ene 2006 año
690.099 bn
+76.675 bn
12.5%
1 ene 2007 año
816.682 bn
+126.582 bn
18.34%
1 ene 2008 año
862.247 bn
+45.566 bn
5.58%
1 ene 2009 año
943.191 bn
+80.943 bn
9.39%
1 ene 2010 año
878.267 bn
-64.923 bn
-6.88%
1 ene 2011 año
1.01 billones
+131.843 bn
15.01%
1 ene 2012 año
1.061 billones
+50.529 bn
5.0%
1 ene 2013 año
1.069 billones
+8.492 bn
0.8%
1 ene 2014 año
1.297 billones
+227.45 bn
21.27%
1 ene 2015 año
1.37 billones
+73.595 bn
5.68%
1 ene 2016 año
1.51 billones
+139.808 bn
10.2%

Ranking de los países por los datos estadísticos actuales