33
/es/
AIzaSyAYiBZKx7MnpbEhh9jyipgxe19OcubqV5w
August 1, 2025
119817
Djibouti
DJI
true
2
1
Exports of goods and services (constant LCU)
2007,2006,2005,2004,2003,2002,2001,2000,1999,1998,1997,1996,1995,1994,1993,1992,1991
Download
Estadísticas Globales de la Biblioteca →Djibouti →

Exports of goods and services (constant LCU)

Estas estadísticas en otros países:

AlbaniaAlgeriaAngolaAntigua and BarbudaArgentinaArmeniaAustraliaAustriaAzerbaijanBahamas, TheBahrainBangladeshBarbadosBelarusBelgiumBelizeBeninBhutanBoliviaBosnia and HerzegovinaBotswanaBrazilBrunei DarussalamBulgariaBurkina FasoBurundiCabo VerdeCambodiaCameroonCanadaChadChileColombiaComorosCongo, Dem. Rep.Congo, Rep.Costa RicaCote d'IvoireCroatiaCubaCyprusCzech RepublicDenmarkDjiboutiDominican RepublicEcuadorEgypt, Arab Rep.El SalvadorEquatorial GuineaEritreaEstoniaEthiopiaFijiFinlandFranceGabonGambia, TheGeorgiaGermanyGhanaGreeceGuatemalaGuineaGuinea-BissauHaitiHondurasHong Kong SAR, ChinaHungaryIcelandIndiaIndonesiaIran, Islamic Rep.IrelandIsraelItalyJamaicaJapanJordanKazakhstanKenyaKorea, Rep.KosovoKuwaitKyrgyz RepublicLao PDRLatviaLebanonLiberiaLibyaLithuaniaLuxembourgMacao SAR, ChinaMacedonia, FYRMadagascarMalawiMalaysiaMaliMaltaMauritaniaMauritiusMexicoMoldovaMongoliaMontenegroMoroccoMozambiqueMyanmarNamibiaNepalNetherlandsNew ZealandNicaraguaNigerNigeriaNorwayOmanPakistanPanamaPapua New GuineaParaguayPeruPhilippinesPolandPortugalPuerto RicoQatarRomaniaRussian FederationRwandaSamoaSaudi ArabiaSenegalSerbiaSeychellesSierra LeoneSingaporeSlovak RepublicSloveniaSomaliaSouth AfricaSouth SudanSpainSri LankaSudanSurinameSwazilandSwedenSwitzerlandSyrian Arab RepublicTajikistanTanzaniaThailandTimor-LesteTogoTrinidad and TobagoTunisiaTurkeyTurkmenistanUgandaUkraineUnited Arab EmiratesUnited KingdomUnited StatesUruguayUzbekistanVanuatuVenezuela, RBVietnamWest Bank and GazaZambiaZimbabwe

línea de tiempo (timeline):

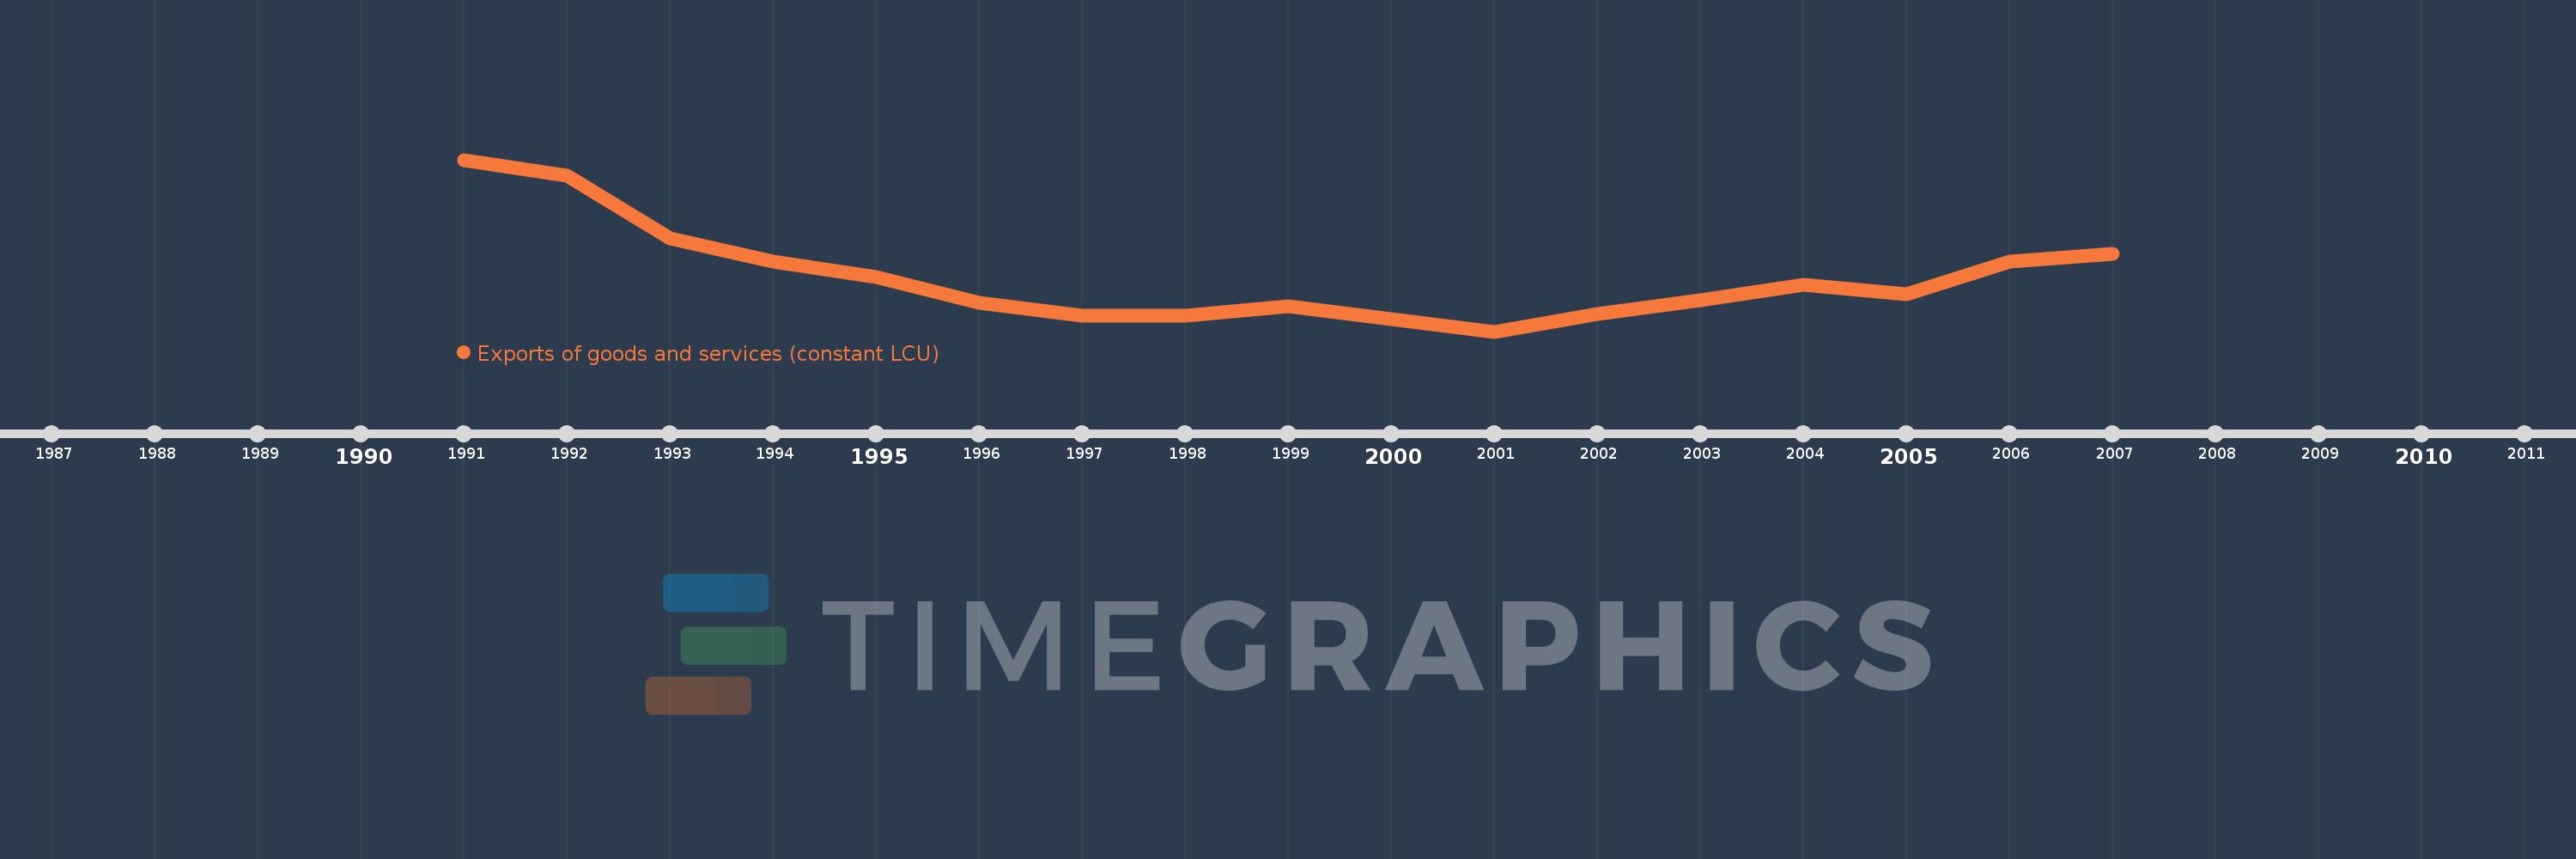
En esta escala de tiempo se presenta un gráfico de 1991 y 2007 de Djibouti. Los datos de 1990 están ausentes. El número de observaciones reales por fecha: 17.

Fuente (nombre):

Indicadores del desarrollo mundial

Fuente (organización):

World Bank national accounts data, and OECD National Accounts data files.

Categorías:

Economy & Growth

Se ha actualizado:

23 abr 2017 año

Los indicadores de los cambios de valor en los últimos años

En promedio:
29.795 bn
Mínimo:
23.533 bn
1 ene 2001 año
Máximo:
43.279 bn
1 ene 1991 año
A la fecha de observación
Valor
Cambio absoluto
El cambio con respecto al valor anterior
1 ene 1991 año
43.279 bn
+43.279 bn
0.0%
1 ene 1992 año
41.428 bn
-1.851 bn
-4.28%
1 ene 1993 año
34.284 bn
-7.144 bn
-17.24%
1 ene 1994 año
31.596 bn
-2.689 bn
-7.84%
1 ene 1995 año
29.836 bn
-1.76 bn
-5.57%
1 ene 1996 año
26.884 bn
-2.953 bn
-9.9%
1 ene 1997 año
25.364 bn
-1.519 bn
-5.65%
1 ene 1998 año
25.376 bn
+11.6 millones
0.05%
1 ene 1999 año
26.462 bn
+1.085 bn
4.28%
1 ene 2000 año
24.946 bn
-1.516 bn
-5.73%
1 ene 2001 año
23.533 bn
-1.413 bn
-5.66%
1 ene 2002 año
25.549 bn
+2.016 bn
8.57%
1 ene 2003 año
27.114 bn
+1.566 bn
6.13%
1 ene 2004 año
28.955 bn
+1.84 bn
6.79%
1 ene 2005 año
27.854 bn
-1.1 bn
-3.8%
1 ene 2006 año
31.583 bn
+3.728 bn
13.38%
1 ene 2007 año
32.478 bn
+895.152 millones
2.83%

Ranking de los países por los datos estadísticos actuales