33
/es/
AIzaSyAYiBZKx7MnpbEhh9jyipgxe19OcubqV5w
August 1, 2025
64639
Albania
ALB
true
2
1
Exports of goods and services (constant LCU)
2016,2015,2014,2013,2012,2011,2010,2009,2008,2007,2006,2005,2004,2003,2002,2001,2000,1999,1998,1997
Download
Estadísticas Globales de la Biblioteca →Albania →

Exports of goods and services (constant LCU)

Estas estadísticas en otros países:

AlbaniaAlgeriaAngolaAntigua and BarbudaArgentinaArmeniaAustraliaAustriaAzerbaijanBahamas, TheBahrainBangladeshBarbadosBelarusBelgiumBelizeBeninBhutanBoliviaBosnia and HerzegovinaBotswanaBrazilBrunei DarussalamBulgariaBurkina FasoBurundiCabo VerdeCambodiaCameroonCanadaChadChileColombiaComorosCongo, Dem. Rep.Congo, Rep.Costa RicaCote d'IvoireCroatiaCubaCyprusCzech RepublicDenmarkDjiboutiDominican RepublicEcuadorEgypt, Arab Rep.El SalvadorEquatorial GuineaEritreaEstoniaEthiopiaFijiFinlandFranceGabonGambia, TheGeorgiaGermanyGhanaGreeceGuatemalaGuineaGuinea-BissauHaitiHondurasHong Kong SAR, ChinaHungaryIcelandIndiaIndonesiaIran, Islamic Rep.IrelandIsraelItalyJamaicaJapanJordanKazakhstanKenyaKorea, Rep.KosovoKuwaitKyrgyz RepublicLao PDRLatviaLebanonLiberiaLibyaLithuaniaLuxembourgMacao SAR, ChinaMacedonia, FYRMadagascarMalawiMalaysiaMaliMaltaMauritaniaMauritiusMexicoMoldovaMongoliaMontenegroMoroccoMozambiqueMyanmarNamibiaNepalNetherlandsNew ZealandNicaraguaNigerNigeriaNorwayOmanPakistanPanamaPapua New GuineaParaguayPeruPhilippinesPolandPortugalPuerto RicoQatarRomaniaRussian FederationRwandaSamoaSaudi ArabiaSenegalSerbiaSeychellesSierra LeoneSingaporeSlovak RepublicSloveniaSomaliaSouth AfricaSouth SudanSpainSri LankaSudanSurinameSwazilandSwedenSwitzerlandSyrian Arab RepublicTajikistanTanzaniaThailandTimor-LesteTogoTrinidad and TobagoTunisiaTurkeyTurkmenistanUgandaUkraineUnited Arab EmiratesUnited KingdomUnited StatesUruguayUzbekistanVanuatuVenezuela, RBVietnamWest Bank and GazaZambiaZimbabwe

línea de tiempo (timeline):

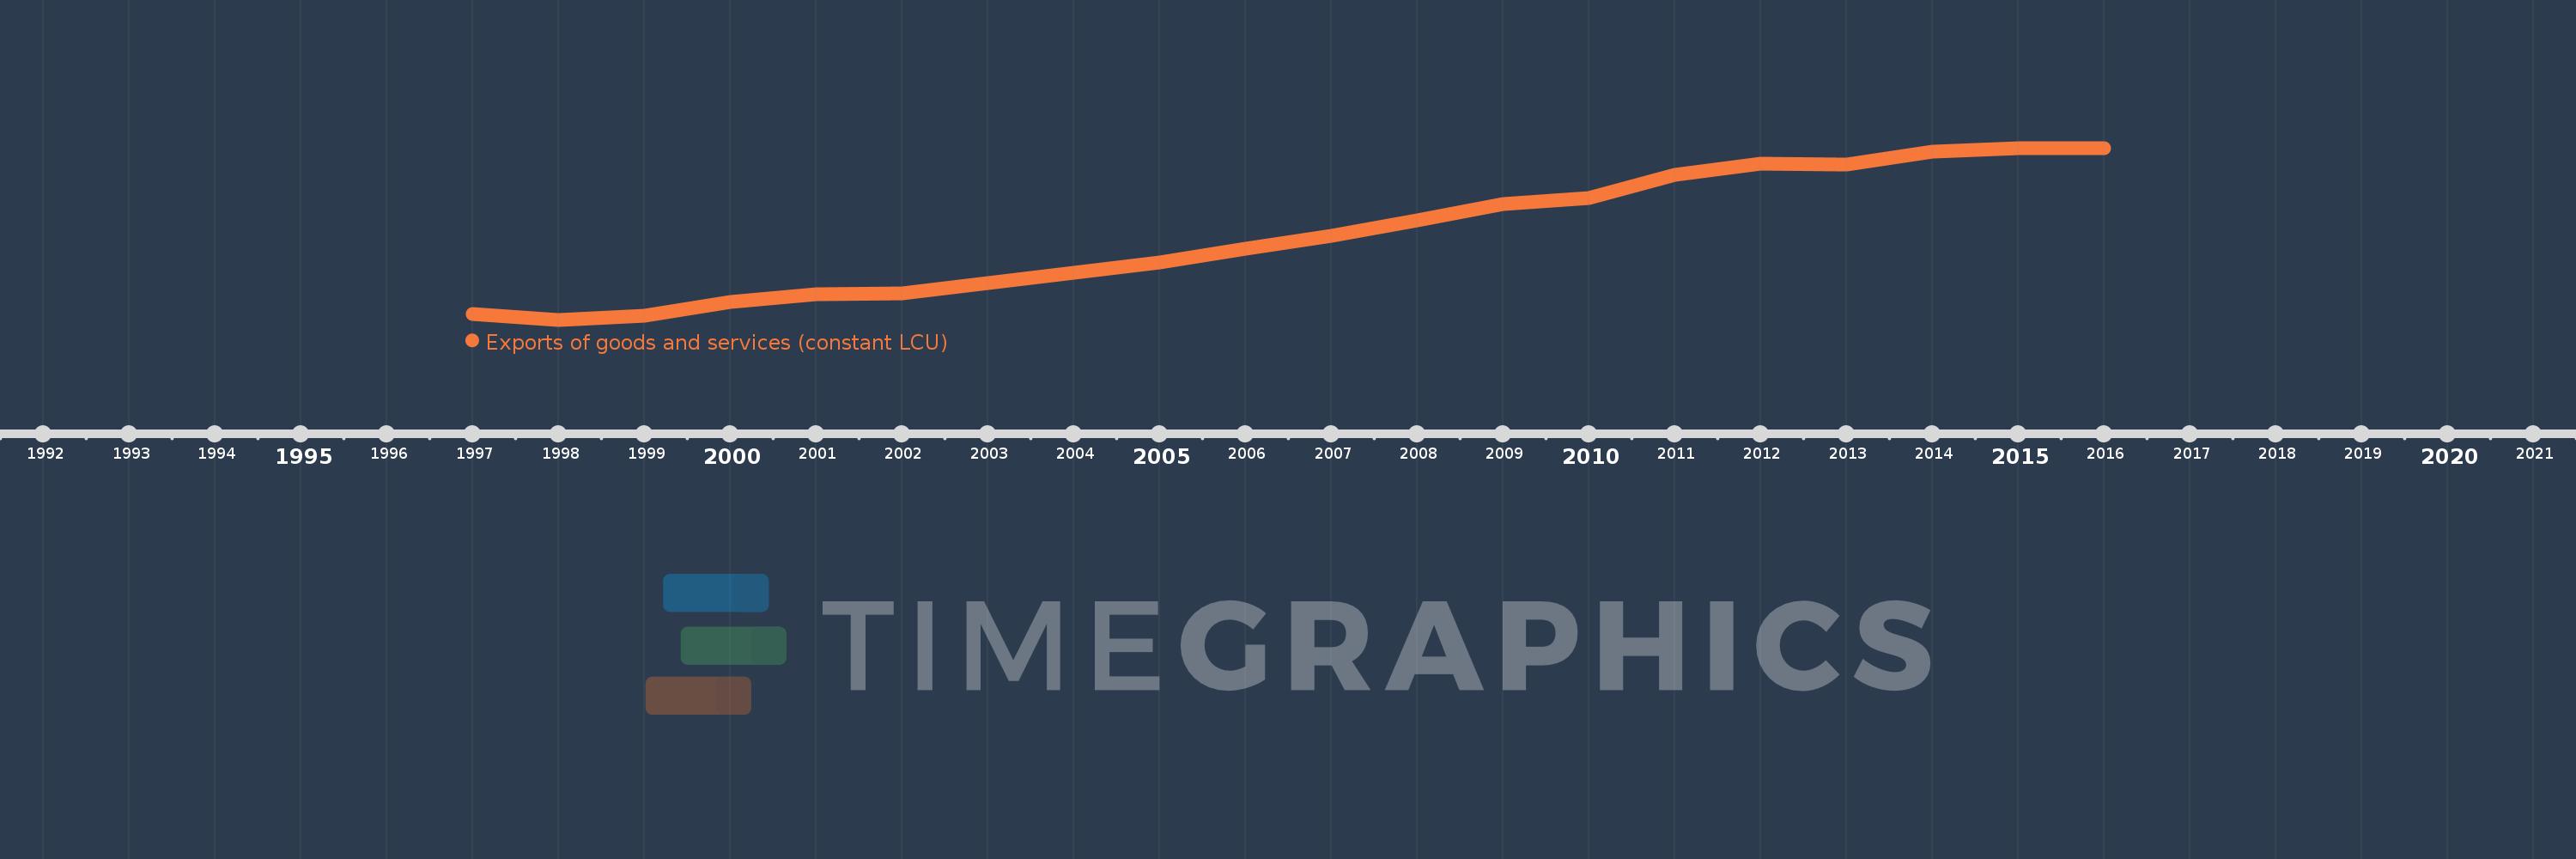
En esta escala de tiempo se presenta un gráfico de 1997 y 2016 de Albania. Los datos de 1996 están ausentes. El número de observaciones reales por fecha: 20.

Fuente (nombre):

Indicadores del desarrollo mundial

Fuente (organización):

World Bank national accounts data, and OECD National Accounts data files.

Categorías:

Economy & Growth

Se ha actualizado:

23 abr 2017 año

Los indicadores de los cambios de valor en los últimos años

En promedio:
184.711 bn
Mínimo:
28.822 bn
1 ene 1998 año
Máximo:
347.582 bn
1 ene 2015 año
A la fecha de observación
Valor
Cambio absoluto
El cambio con respecto al valor anterior
1 ene 1997 año
38.782 bn
+38.782 bn
0.0%
1 ene 1998 año
28.822 bn
-9.96 bn
-25.68%
1 ene 1999 año
35.682 bn
+6.86 bn
23.8%
1 ene 2000 año
61.75 bn
+26.068 bn
73.06%
1 ene 2001 año
76.342 bn
+14.591 bn
23.63%
1 ene 2002 año
77.294 bn
+952.189 millones
1.25%
1 ene 2003 año
97.495 bn
+20.201 bn
26.14%
1 ene 2004 año
116.505 bn
+19.01 bn
19.5%
1 ene 2005 año
135.879 bn
+19.374 bn
16.63%
1 ene 2006 año
160.437 bn
+24.559 bn
18.07%
1 ene 2007 año
184.685 bn
+24.247 bn
15.11%
1 ene 2008 año
212.985 bn
+28.301 bn
15.32%
1 ene 2009 año
243.787 bn
+30.802 bn
14.46%
1 ene 2010 año
254.401 bn
+10.615 bn
4.35%
1 ene 2011 año
297.054 bn
+42.652 bn
16.77%
1 ene 2012 año
319.052 bn
+21.998 bn
7.41%
1 ene 2013 año
317.014 bn
-2.038 bn
-0.64%
1 ene 2014 año
341.436 bn
+24.422 bn
7.7%
1 ene 2015 año
347.582 bn
+6.146 bn
1.8%
1 ene 2016 año
347.235 bn
-347.582 millones
-0.1%

Ranking de los países por los datos estadísticos actuales