33
/es/
AIzaSyAYiBZKx7MnpbEhh9jyipgxe19OcubqV5w
May 1, 2025
66032
Algeria
DZA
true
2
1
GNI, PPP (current international $)
2016,2015,2014,2013,2012,2011,2010,2009,2008,2007,2006,2005,2004,2003,2002,2001,2000,1999,1998,1997,1996,1995,1994,1993,1992,1991
Download
Estadísticas Globales de la Biblioteca →Algeria →

GNI, PPP (current international $)

Estas estadísticas en otros países:

AfghanistanAlbaniaAlgeriaAngolaAntigua and BarbudaArab WorldArgentinaArmeniaAustraliaAustriaAzerbaijanBahamas, TheBahrainBangladeshBarbadosBelarusBelgiumBelizeBeninBermudaBhutanBoliviaBosnia and HerzegovinaBotswanaBrazilBrunei DarussalamBulgariaBurkina FasoBurundiCabo VerdeCambodiaCameroonCanadaCaribbean small statesCentral African RepublicCentral Europe and the BalticsChadChileChinaColombiaComorosCongo, Dem. Rep.Congo, Rep.Costa RicaCote d'IvoireCroatiaCubaCyprusCzech RepublicDenmarkDjiboutiDominicaDominican RepublicEarly-demographic dividendEast Asia & PacificEast Asia & Pacific (excluding high income)East Asia & Pacific (IDA & IBRD countries)EcuadorEgypt, Arab Rep.El SalvadorEquatorial GuineaEritreaEstoniaEthiopiaEuro areaEurope & Central AsiaEurope & Central Asia (excluding high income)Europe & Central Asia (IDA & IBRD countries)European UnionFijiFinlandFragile and conflict affected situationsFranceGabonGambia, TheGeorgiaGermanyGhanaGreeceGrenadaGuatemalaGuineaGuinea-BissauGuyanaHaitiHeavily indebted poor countries (HIPC)High incomeHondurasHong Kong SAR, ChinaHungaryIBRD onlyIcelandIDA & IBRD totalIDA blendIDA onlyIDA totalIndiaIndonesiaIran, Islamic Rep.IraqIrelandIsraelItalyJamaicaJapanJordanKazakhstanKenyaKiribatiKorea, Rep.KosovoKuwaitKyrgyz RepublicLao PDRLate-demographic dividendLatin America & Caribbean Latin America & Caribbean (excluding high income)Latin America & the Caribbean (IDA & IBRD countries)LatviaLeast developed countries: UN classificationLebanonLesothoLiberiaLibyaLithuaniaLow & middle incomeLow incomeLower middle incomeLuxembourgMacao SAR, ChinaMacedonia, FYRMadagascarMalawiMalaysiaMaldivesMaliMaltaMarshall IslandsMauritaniaMauritiusMexicoMicronesia, Fed. Sts.Middle East & North AfricaMiddle East & North Africa (excluding high income)Middle East & North Africa (IDA & IBRD countries)Middle incomeMoldovaMongoliaMontenegroMoroccoMozambiqueMyanmarNamibiaNauruNepalNetherlandsNew ZealandNicaraguaNigerNigeriaNorth AmericaNorwayOECD membersOmanOther small statesPacific island small statesPakistanPalauPanamaPapua New GuineaParaguayPeruPhilippinesPolandPortugalPost-demographic dividendPre-demographic dividendPuerto RicoQatarRomaniaRussian FederationRwandaSamoaSao Tome and PrincipeSaudi ArabiaSenegalSerbiaSeychellesSierra LeoneSingaporeSlovak RepublicSloveniaSmall statesSolomon IslandsSouth AfricaSouth AsiaSouth Asia (IDA & IBRD)South SudanSpainSri LankaSt. Kitts and NevisSt. LuciaSt. Vincent and the GrenadinesSub-Saharan Africa Sub-Saharan Africa (excluding high income)Sub-Saharan Africa (IDA & IBRD countries)SudanSurinameSwazilandSwedenSwitzerlandTajikistanTanzaniaThailandTimor-LesteTogoTongaTrinidad and TobagoTunisiaTurkeyTurkmenistanTuvaluUgandaUkraineUnited Arab EmiratesUnited KingdomUnited StatesUpper middle incomeUruguayUzbekistanVanuatuVenezuela, RBVietnamWest Bank and GazaWorldYemen, Rep.ZambiaZimbabwe

línea de tiempo (timeline):

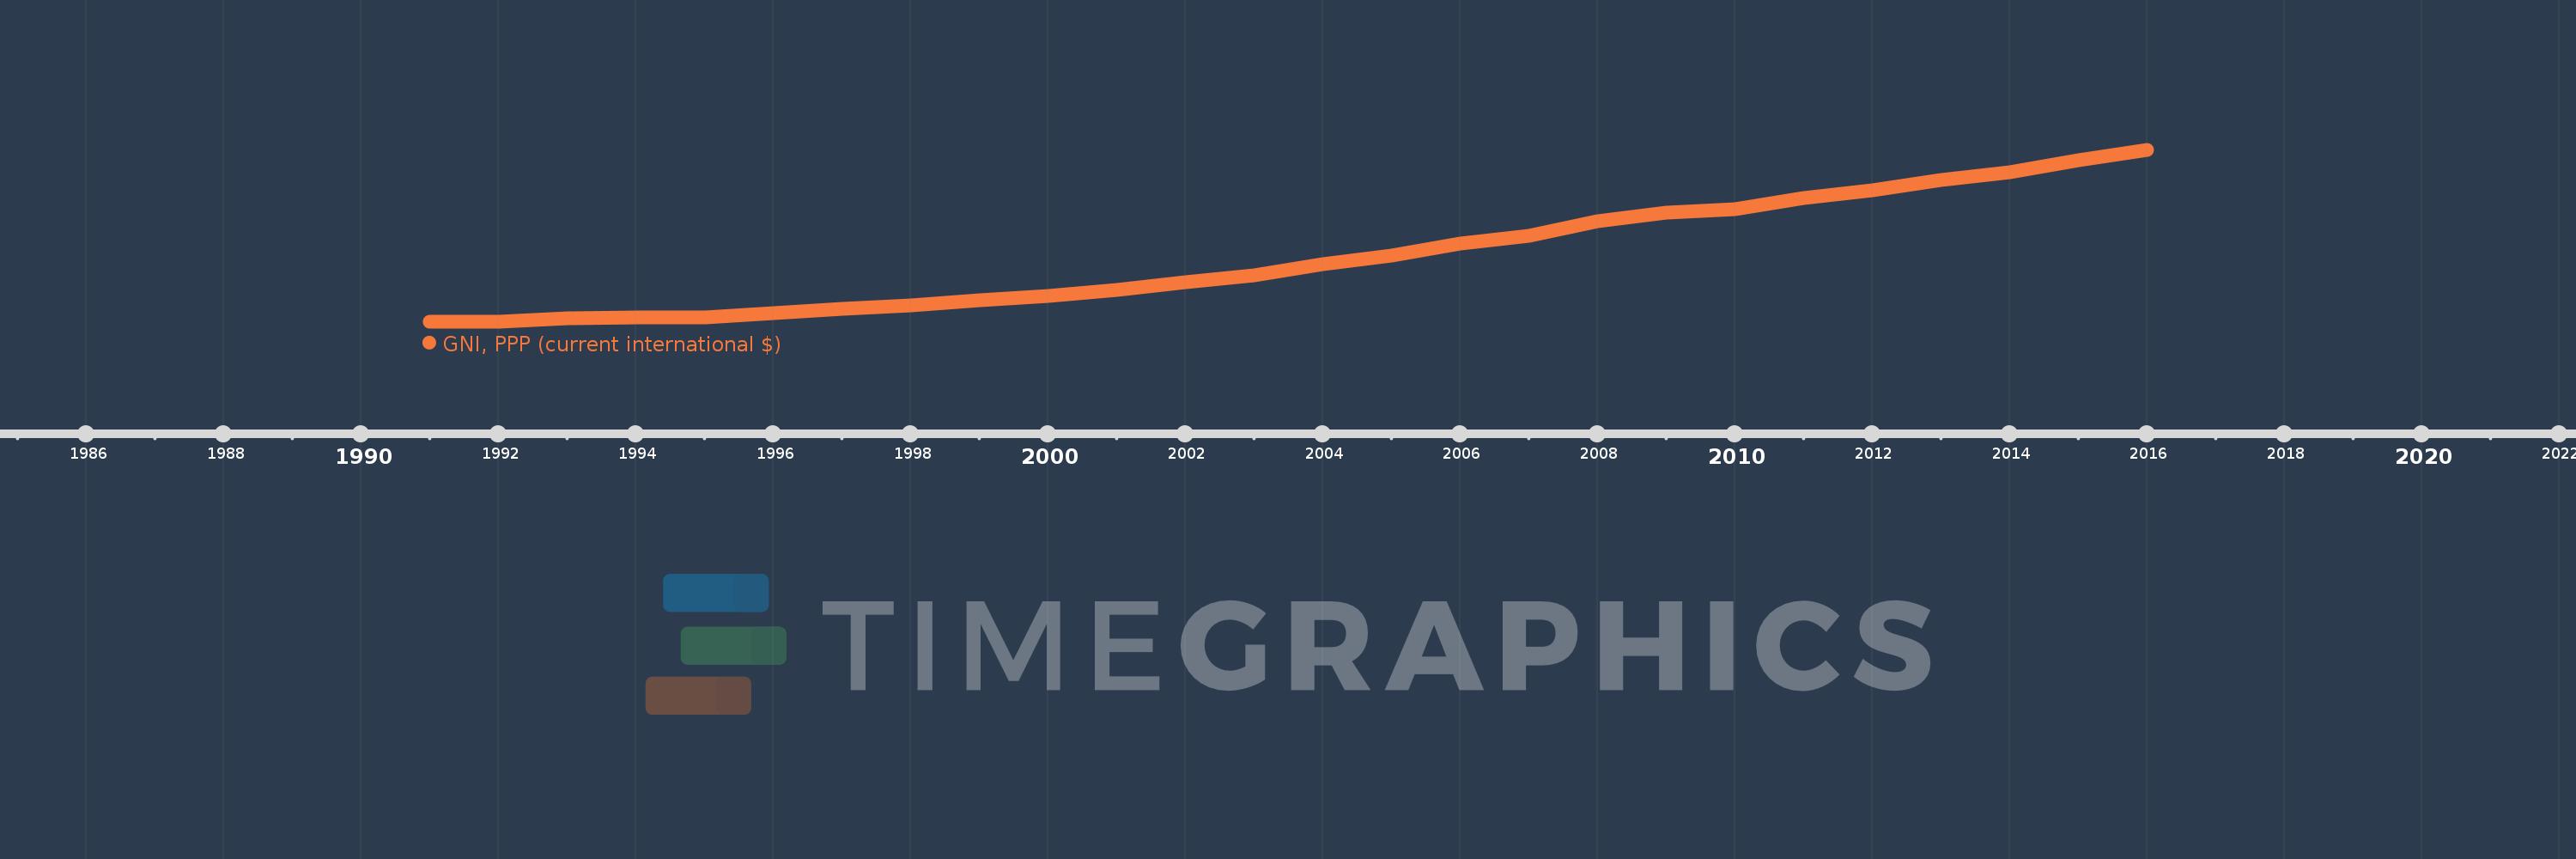
En esta escala de tiempo se presenta un gráfico de 1991 y 2016 de Algeria. Los datos de 1990 están ausentes. El número de observaciones reales por fecha: 26.

Fuente (nombre):

Indicadores del desarrollo mundial

Fuente (organización):

World Bank, International Comparison Program database.

Categorías:

Economy & Growth

Se ha actualizado:

23 abr 2017 año

Los indicadores de los cambios de valor en los últimos años

En promedio:
319.482 bn
Mínimo:
165.705 bn
1 ene 1991 año
Máximo:
567.741 bn
1 ene 2016 año
A la fecha de observación
Valor
Cambio absoluto
El cambio con respecto al valor anterior
1 ene 1991 año
165.705 bn
+165.705 bn
0.0%
1 ene 1992 año
166.561 bn
+856.611 millones
0.52%
1 ene 1993 año
174.074 bn
+7.513 bn
4.51%
1 ene 1994 año
176.293 bn
+2.219 bn
1.27%
1 ene 1995 año
177.363 bn
+1.07 bn
0.61%
1 ene 1996 año
185.658 bn
+8.295 bn
4.68%
1 ene 1997 año
196.362 bn
+10.704 bn
5.77%
1 ene 1998 año
203.726 bn
+7.364 bn
3.75%
1 ene 1999 año
217.478 bn
+13.752 bn
6.75%
1 ene 2000 año
226.546 bn
+9.068 bn
4.17%
1 ene 2001 año
239.905 bn
+13.359 bn
5.9%
1 ene 2002 año
258.136 bn
+18.231 bn
7.6%
1 ene 2003 año
274.074 bn
+15.938 bn
6.17%
1 ene 2004 año
300.43 bn
+26.356 bn
9.62%
1 ene 2005 año
320.289 bn
+19.859 bn
6.61%
1 ene 2006 año
348.908 bn
+28.619 bn
8.94%
1 ene 2007 año
368.29 bn
+19.382 bn
5.56%
1 ene 2008 año
400.935 bn
+32.645 bn
8.86%
1 ene 2009 año
421.002 bn
+20.067 bn
5.0%
1 ene 2010 año
430.432 bn
+9.43 bn
2.24%
1 ene 2011 año
454.807 bn
+24.375 bn
5.66%
1 ene 2012 año
473.77 bn
+18.963 bn
4.17%
1 ene 2013 año
498.079 bn
+24.309 bn
5.13%
1 ene 2014 año
516.296 bn
+18.218 bn
3.66%
1 ene 2015 año
543.685 bn
+27.389 bn
5.3%
1 ene 2016 año
567.741 bn
+24.055 bn
4.42%

Ranking de los países por los datos estadísticos actuales