29
/es/
es
AIzaSyAYiBZKx7MnpbEhh9jyipgxe19OcubqV5w
April 1, 2024
141839
Greece
GRC
true
2
1
GNI, PPP (current international $)
2016,2015,2014,2013,2012,2011,2010,2009,2008,2007,2006,2005,2004,2003,2002,2001,2000,1999,1998,1997,1996,1995,1994,1993,1992,1991
Download
Estadísticas Globales de la Biblioteca →Greece →

GNI, PPP (current international $)

Estas estadísticas en otros países:
AfghanistanAlbaniaAlgeriaAngolaAntigua and BarbudaArab WorldArgentinaArmeniaAustraliaAustriaAzerbaijanBahamas, TheBahrainBangladeshBarbadosBelarusBelgiumBelizeBeninBermudaBhutanBoliviaBosnia and HerzegovinaBotswanaBrazilBrunei DarussalamBulgariaBurkina FasoBurundiCabo VerdeCambodiaCameroonCanadaCaribbean small statesCentral African RepublicCentral Europe and the BalticsChadChileChinaColombiaComorosCongo, Dem. Rep.Congo, Rep.Costa RicaCote d'IvoireCroatiaCubaCyprusCzech RepublicDenmarkDjiboutiDominicaDominican RepublicEarly-demographic dividendEast Asia & PacificEast Asia & Pacific (excluding high income)East Asia & Pacific (IDA & IBRD countries)EcuadorEgypt, Arab Rep.El SalvadorEquatorial GuineaEritreaEstoniaEthiopiaEuro areaEurope & Central AsiaEurope & Central Asia (excluding high income)Europe & Central Asia (IDA & IBRD countries)European UnionFijiFinlandFragile and conflict affected situationsFranceGabonGambia, TheGeorgiaGermanyGhanaGreeceGrenadaGuatemalaGuineaGuinea-BissauGuyanaHaitiHeavily indebted poor countries (HIPC)High incomeHondurasHong Kong SAR, ChinaHungaryIBRD onlyIcelandIDA & IBRD totalIDA blendIDA onlyIDA totalIndiaIndonesiaIran, Islamic Rep.IraqIrelandIsraelItalyJamaicaJapanJordanKazakhstanKenyaKiribatiKorea, Rep.KosovoKuwaitKyrgyz RepublicLao PDRLate-demographic dividendLatin America & Caribbean Latin America & Caribbean (excluding high income)Latin America & the Caribbean (IDA & IBRD countries)LatviaLeast developed countries: UN classificationLebanonLesothoLiberiaLibyaLithuaniaLow & middle incomeLow incomeLower middle incomeLuxembourgMacao SAR, ChinaMacedonia, FYRMadagascarMalawiMalaysiaMaldivesMaliMaltaMarshall IslandsMauritaniaMauritiusMexicoMicronesia, Fed. Sts.Middle East & North AfricaMiddle East & North Africa (excluding high income)Middle East & North Africa (IDA & IBRD countries)Middle incomeMoldovaMongoliaMontenegroMoroccoMozambiqueMyanmarNamibiaNauruNepalNetherlandsNew ZealandNicaraguaNigerNigeriaNorth AmericaNorwayOECD membersOmanOther small statesPacific island small statesPakistanPalauPanamaPapua New GuineaParaguayPeruPhilippinesPolandPortugalPost-demographic dividendPre-demographic dividendPuerto RicoQatarRomaniaRussian FederationRwandaSamoaSao Tome and PrincipeSaudi ArabiaSenegalSerbiaSeychellesSierra LeoneSingaporeSlovak RepublicSloveniaSmall statesSolomon IslandsSouth AfricaSouth AsiaSouth Asia (IDA & IBRD)South SudanSpainSri LankaSt. Kitts and NevisSt. LuciaSt. Vincent and the GrenadinesSub-Saharan Africa Sub-Saharan Africa (excluding high income)Sub-Saharan Africa (IDA & IBRD countries)SudanSurinameSwazilandSwedenSwitzerlandTajikistanTanzaniaThailandTimor-LesteTogoTongaTrinidad and TobagoTunisiaTurkeyTurkmenistanTuvaluUgandaUkraineUnited Arab EmiratesUnited KingdomUnited StatesUpper middle incomeUruguayUzbekistanVanuatuVenezuela, RBVietnamWest Bank and GazaWorldYemen, Rep.ZambiaZimbabwe
línea de tiempo (timeline):
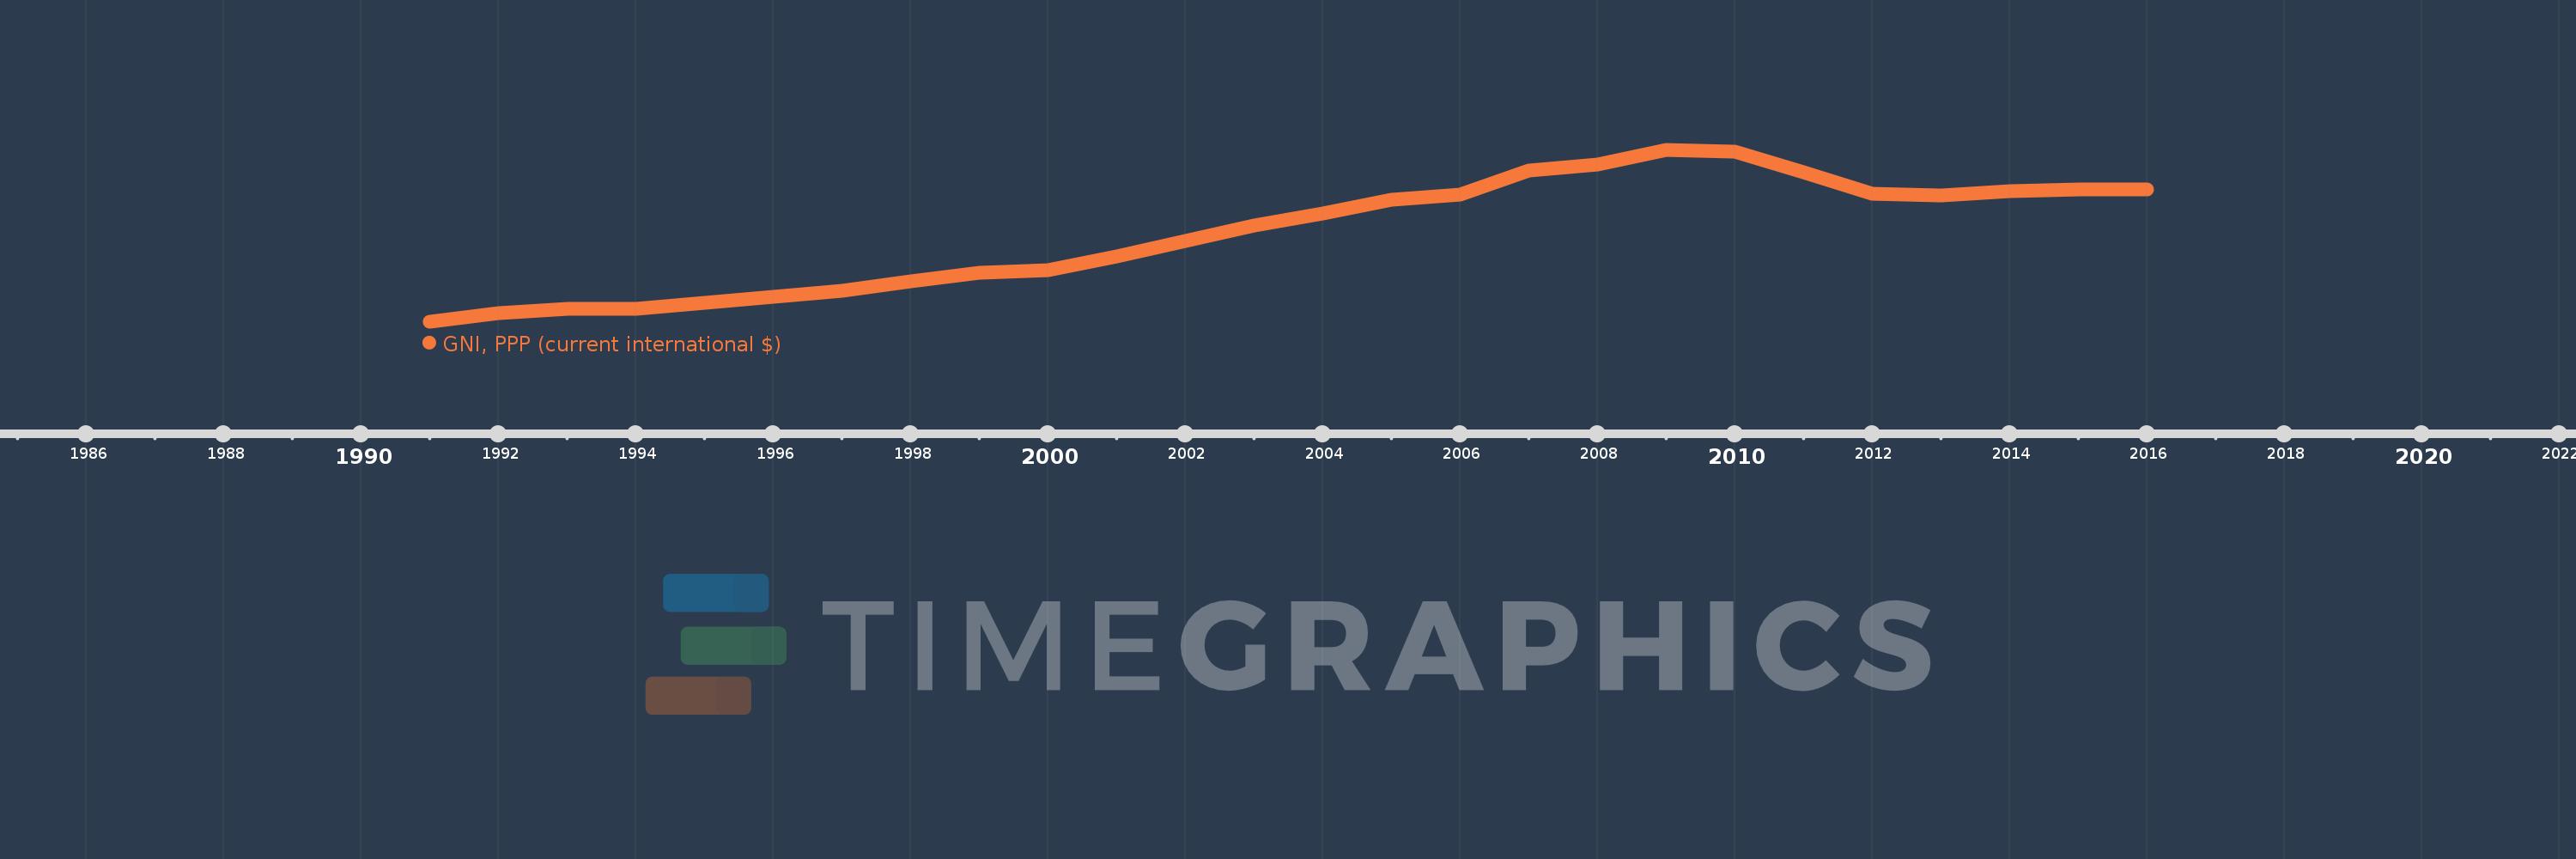
En esta escala de tiempo se presenta un gráfico de 1991 y 2016 de Greece. Los datos de 1990 están ausentes. El número de observaciones reales por fecha: 26.
Fuente (nombre):
Indicadores del desarrollo mundial
Fuente (organización):
World Bank, International Comparison Program database.
Categorías:
Economy & Growth
Se ha actualizado:
23 abr 2017 año
Los indicadores de los cambios de valor en los últimos años
En promedio:
238.126 bn
Mínimo:
138.462 bn
1 ene 1991 año
Máximo:
331.637 bn
1 ene 2009 año
A la fecha de observación
Valor
Cambio absoluto
El cambio con respecto al valor anterior
1 ene 1991 año
138.462 bn
+138.462 bn
0.0%
1 ene 1992 año
148.116 bn
+9.654 bn
6.97%
1 ene 1993 año
153.026 bn
+4.91 bn
3.31%
1 ene 1994 año
153.66 bn
+634.01 millones
0.41%
1 ene 1995 año
160.125 bn
+6.465 bn
4.21%
1 ene 1996 año
166.94 bn
+6.815 bn
4.26%
1 ene 1997 año
173.737 bn
+6.797 bn
4.07%
1 ene 1998 año
184.489 bn
+10.752 bn
6.19%
1 ene 1999 año
194.045 bn
+9.556 bn
5.18%
1 ene 2000 año
196.471 bn
+2.426 bn
1.25%
1 ene 2001 año
212.199 bn
+15.729 bn
8.01%
1 ene 2002 año
229.976 bn
+17.777 bn
8.38%
1 ene 2003 año
246.506 bn
+16.53 bn
7.19%
1 ene 2004 año
260.095 bn
+13.589 bn
5.51%
1 ene 2005 año
275.597 bn
+15.502 bn
5.96%
1 ene 2006 año
281.472 bn
+5.875 bn
2.13%
1 ene 2007 año
308.64 bn
+27.168 bn
9.65%
1 ene 2008 año
315.169 bn
+6.529 bn
2.12%
1 ene 2009 año
331.637 bn
+16.468 bn
5.23%
1 ene 2010 año
330.119 bn
-1.518 bn
-0.46%
1 ene 2011 año
307.228 bn
-22.891 bn
-6.93%
1 ene 2012 año
282.371 bn
-24.857 bn
-8.09%
1 ene 2013 año
281.12 bn
-1.251 bn
-0.44%
1 ene 2014 año
285.557 bn
+4.436 bn
1.58%
1 ene 2015 año
287.414 bn
+1.857 bn
0.65%
1 ene 2016 año
287.114 bn
-299.474 millones
-0.1%
Ranking de los países por los datos estadísticos actuales

Comentarios:

Enviar
PremiumAbout & FeedbackAcuerdoPrivacidad
logo
© 2022 Selected Technologies LLC – Morgan Hill, California