33
/es/
AIzaSyAYiBZKx7MnpbEhh9jyipgxe19OcubqV5w
August 1, 2025
190267
Mali
MLI
true
2
1
GNI, PPP (current international $)
2016,2015,2014,2013,2012,2011,2010,2009,2008,2007,2006,2005,2004,2003,2002,2001,2000,1999,1998,1997,1996,1995,1994,1993,1992,1991
Download
Estadísticas Globales de la Biblioteca →Mali →

GNI, PPP (current international $)

Estas estadísticas en otros países:

AfghanistanAlbaniaAlgeriaAngolaAntigua and BarbudaArab WorldArgentinaArmeniaAustraliaAustriaAzerbaijanBahamas, TheBahrainBangladeshBarbadosBelarusBelgiumBelizeBeninBermudaBhutanBoliviaBosnia and HerzegovinaBotswanaBrazilBrunei DarussalamBulgariaBurkina FasoBurundiCabo VerdeCambodiaCameroonCanadaCaribbean small statesCentral African RepublicCentral Europe and the BalticsChadChileChinaColombiaComorosCongo, Dem. Rep.Congo, Rep.Costa RicaCote d'IvoireCroatiaCubaCyprusCzech RepublicDenmarkDjiboutiDominicaDominican RepublicEarly-demographic dividendEast Asia & PacificEast Asia & Pacific (excluding high income)East Asia & Pacific (IDA & IBRD countries)EcuadorEgypt, Arab Rep.El SalvadorEquatorial GuineaEritreaEstoniaEthiopiaEuro areaEurope & Central AsiaEurope & Central Asia (excluding high income)Europe & Central Asia (IDA & IBRD countries)European UnionFijiFinlandFragile and conflict affected situationsFranceGabonGambia, TheGeorgiaGermanyGhanaGreeceGrenadaGuatemalaGuineaGuinea-BissauGuyanaHaitiHeavily indebted poor countries (HIPC)High incomeHondurasHong Kong SAR, ChinaHungaryIBRD onlyIcelandIDA & IBRD totalIDA blendIDA onlyIDA totalIndiaIndonesiaIran, Islamic Rep.IraqIrelandIsraelItalyJamaicaJapanJordanKazakhstanKenyaKiribatiKorea, Rep.KosovoKuwaitKyrgyz RepublicLao PDRLate-demographic dividendLatin America & Caribbean Latin America & Caribbean (excluding high income)Latin America & the Caribbean (IDA & IBRD countries)LatviaLeast developed countries: UN classificationLebanonLesothoLiberiaLibyaLithuaniaLow & middle incomeLow incomeLower middle incomeLuxembourgMacao SAR, ChinaMacedonia, FYRMadagascarMalawiMalaysiaMaldivesMaliMaltaMarshall IslandsMauritaniaMauritiusMexicoMicronesia, Fed. Sts.Middle East & North AfricaMiddle East & North Africa (excluding high income)Middle East & North Africa (IDA & IBRD countries)Middle incomeMoldovaMongoliaMontenegroMoroccoMozambiqueMyanmarNamibiaNauruNepalNetherlandsNew ZealandNicaraguaNigerNigeriaNorth AmericaNorwayOECD membersOmanOther small statesPacific island small statesPakistanPalauPanamaPapua New GuineaParaguayPeruPhilippinesPolandPortugalPost-demographic dividendPre-demographic dividendPuerto RicoQatarRomaniaRussian FederationRwandaSamoaSao Tome and PrincipeSaudi ArabiaSenegalSerbiaSeychellesSierra LeoneSingaporeSlovak RepublicSloveniaSmall statesSolomon IslandsSouth AfricaSouth AsiaSouth Asia (IDA & IBRD)South SudanSpainSri LankaSt. Kitts and NevisSt. LuciaSt. Vincent and the GrenadinesSub-Saharan Africa Sub-Saharan Africa (excluding high income)Sub-Saharan Africa (IDA & IBRD countries)SudanSurinameSwazilandSwedenSwitzerlandTajikistanTanzaniaThailandTimor-LesteTogoTongaTrinidad and TobagoTunisiaTurkeyTurkmenistanTuvaluUgandaUkraineUnited Arab EmiratesUnited KingdomUnited StatesUpper middle incomeUruguayUzbekistanVanuatuVenezuela, RBVietnamWest Bank and GazaWorldYemen, Rep.ZambiaZimbabwe

línea de tiempo (timeline):

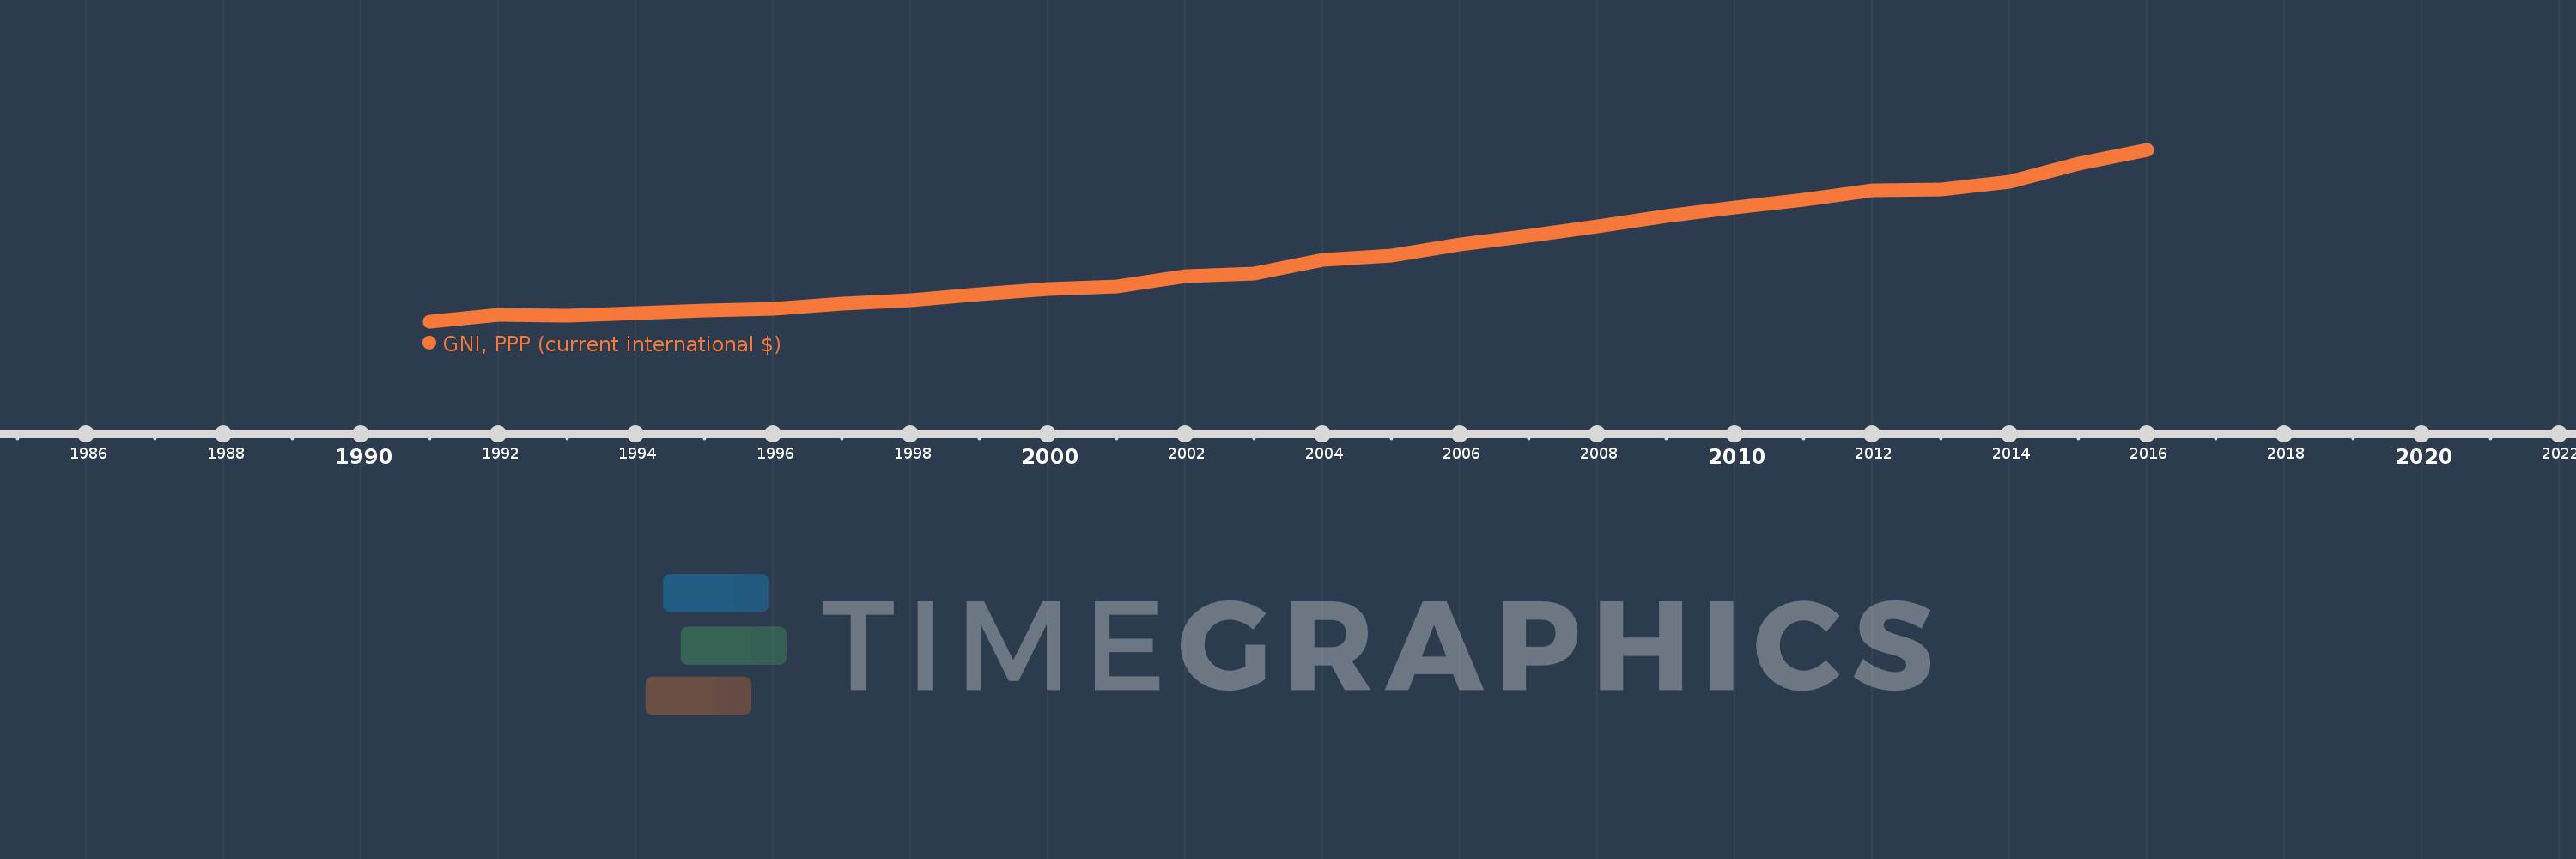
En esta escala de tiempo se presenta un gráfico de 1991 y 2016 de Mali. Los datos de 1990 están ausentes. El número de observaciones reales por fecha: 26.

Fuente (nombre):

Indicadores del desarrollo mundial

Fuente (organización):

World Bank, International Comparison Program database.

Categorías:

Economy & Growth

Se ha actualizado:

23 abr 2017 año

Los indicadores de los cambios de valor en los últimos años

En promedio:
17.715 bn
Mínimo:
6.917 bn
1 ene 1991 año
Máximo:
34.59 bn
1 ene 2016 año
A la fecha de observación
Valor
Cambio absoluto
El cambio con respecto al valor anterior
1 ene 1991 año
6.917 bn
+6.917 bn
0.0%
1 ene 1992 año
8.027 bn
+1.109 bn
16.04%
1 ene 1993 año
7.933 bn
-93.919 millones
-1.17%
1 ene 1994 año
8.407 bn
+474.55 millones
5.98%
1 ene 1995 año
8.804 bn
+397.144 millones
4.72%
1 ene 1996 año
9.013 bn
+208.303 millones
2.37%
1 ene 1997 año
9.82 bn
+807.694 millones
8.96%
1 ene 1998 año
10.452 bn
+631.479 millones
6.43%
1 ene 1999 año
11.392 bn
+940.258 millones
9.0%
1 ene 2000 año
12.281 bn
+888.746 millones
7.8%
1 ene 2001 año
12.588 bn
+307.234 millones
2.5%
1 ene 2002 año
14.288 bn
+1.7 bn
13.51%
1 ene 2003 año
14.741 bn
+452.62 millones
3.17%
1 ene 2004 año
16.892 bn
+2.15 bn
14.59%
1 ene 2005 año
17.638 bn
+746.291 millones
4.42%
1 ene 2006 año
19.401 bn
+1.763 bn
10.0%
1 ene 2007 año
20.838 bn
+1.437 bn
7.41%
1 ene 2008 año
22.374 bn
+1.536 bn
7.37%
1 ene 2009 año
24.006 bn
+1.631 bn
7.29%
1 ene 2010 año
25.309 bn
+1.304 bn
5.43%
1 ene 2011 año
26.565 bn
+1.255 bn
4.96%
1 ene 2012 año
28.098 bn
+1.533 bn
5.77%
1 ene 2013 año
28.237 bn
+139.045 millones
0.49%
1 ene 2014 año
29.555 bn
+1.318 bn
4.67%
1 ene 2015 año
32.413 bn
+2.859 bn
9.67%
1 ene 2016 año
34.59 bn
+2.177 bn
6.72%

Ranking de los países por los datos estadísticos actuales