30
/es/
AIzaSyAYiBZKx7MnpbEhh9jyipgxe19OcubqV5w
April 1, 2024
269360
Turkey
TUR
true
2
1
GNI, PPP (current international $)
2016,2015,2014,2013,2012,2011,2010,2009,2008,2007,2006,2005,2004,2003,2002,2001,2000,1999,1998,1997,1996,1995,1994,1993,1992,1991
Download
Estadísticas Globales de la Biblioteca →Turkey →

GNI, PPP (current international $)

Estas estadísticas en otros países:

AfghanistanAlbaniaAlgeriaAngolaAntigua and BarbudaArab WorldArgentinaArmeniaAustraliaAustriaAzerbaijanBahamas, TheBahrainBangladeshBarbadosBelarusBelgiumBelizeBeninBermudaBhutanBoliviaBosnia and HerzegovinaBotswanaBrazilBrunei DarussalamBulgariaBurkina FasoBurundiCabo VerdeCambodiaCameroonCanadaCaribbean small statesCentral African RepublicCentral Europe and the BalticsChadChileChinaColombiaComorosCongo, Dem. Rep.Congo, Rep.Costa RicaCote d'IvoireCroatiaCubaCyprusCzech RepublicDenmarkDjiboutiDominicaDominican RepublicEarly-demographic dividendEast Asia & PacificEast Asia & Pacific (excluding high income)East Asia & Pacific (IDA & IBRD countries)EcuadorEgypt, Arab Rep.El SalvadorEquatorial GuineaEritreaEstoniaEthiopiaEuro areaEurope & Central AsiaEurope & Central Asia (excluding high income)Europe & Central Asia (IDA & IBRD countries)European UnionFijiFinlandFragile and conflict affected situationsFranceGabonGambia, TheGeorgiaGermanyGhanaGreeceGrenadaGuatemalaGuineaGuinea-BissauGuyanaHaitiHeavily indebted poor countries (HIPC)High incomeHondurasHong Kong SAR, ChinaHungaryIBRD onlyIcelandIDA & IBRD totalIDA blendIDA onlyIDA totalIndiaIndonesiaIran, Islamic Rep.IraqIrelandIsraelItalyJamaicaJapanJordanKazakhstanKenyaKiribatiKorea, Rep.KosovoKuwaitKyrgyz RepublicLao PDRLate-demographic dividendLatin America & Caribbean Latin America & Caribbean (excluding high income)Latin America & the Caribbean (IDA & IBRD countries)LatviaLeast developed countries: UN classificationLebanonLesothoLiberiaLibyaLithuaniaLow & middle incomeLow incomeLower middle incomeLuxembourgMacao SAR, ChinaMacedonia, FYRMadagascarMalawiMalaysiaMaldivesMaliMaltaMarshall IslandsMauritaniaMauritiusMexicoMicronesia, Fed. Sts.Middle East & North AfricaMiddle East & North Africa (excluding high income)Middle East & North Africa (IDA & IBRD countries)Middle incomeMoldovaMongoliaMontenegroMoroccoMozambiqueMyanmarNamibiaNauruNepalNetherlandsNew ZealandNicaraguaNigerNigeriaNorth AmericaNorwayOECD membersOmanOther small statesPacific island small statesPakistanPalauPanamaPapua New GuineaParaguayPeruPhilippinesPolandPortugalPost-demographic dividendPre-demographic dividendPuerto RicoQatarRomaniaRussian FederationRwandaSamoaSao Tome and PrincipeSaudi ArabiaSenegalSerbiaSeychellesSierra LeoneSingaporeSlovak RepublicSloveniaSmall statesSolomon IslandsSouth AfricaSouth AsiaSouth Asia (IDA & IBRD)South SudanSpainSri LankaSt. Kitts and NevisSt. LuciaSt. Vincent and the GrenadinesSub-Saharan Africa Sub-Saharan Africa (excluding high income)Sub-Saharan Africa (IDA & IBRD countries)SudanSurinameSwazilandSwedenSwitzerlandTajikistanTanzaniaThailandTimor-LesteTogoTongaTrinidad and TobagoTunisiaTurkeyTurkmenistanTuvaluUgandaUkraineUnited Arab EmiratesUnited KingdomUnited StatesUpper middle incomeUruguayUzbekistanVanuatuVenezuela, RBVietnamWest Bank and GazaWorldYemen, Rep.ZambiaZimbabwe

línea de tiempo (timeline):

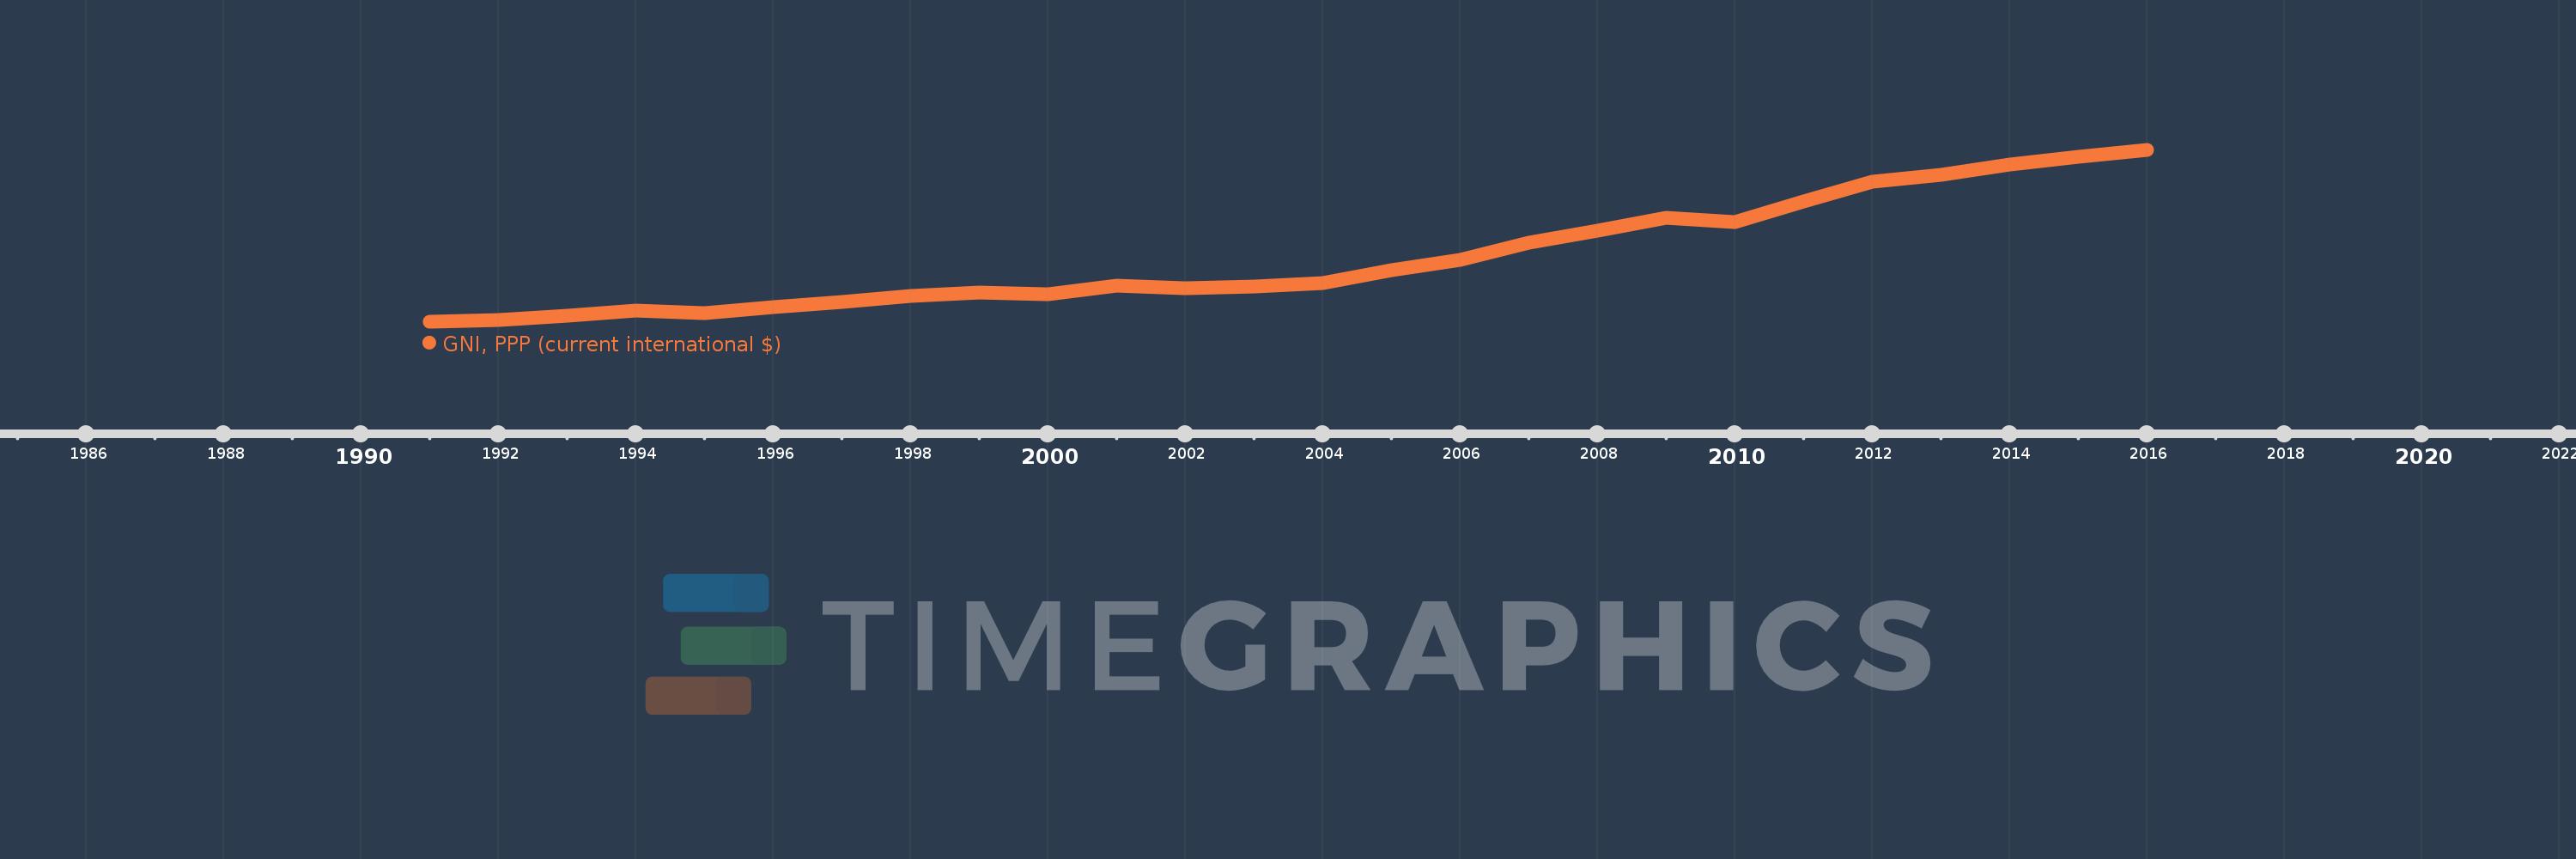
En esta escala de tiempo se presenta un gráfico de 1991 y 2016 de Turkey. Los datos de 1990 están ausentes. El número de observaciones reales por fecha: 26.

Fuente (nombre):

Indicadores del desarrollo mundial

Fuente (organización):

World Bank, International Comparison Program database.

Categorías:

Economy & Growth

Se ha actualizado:

23 abr 2017 año

Los indicadores de los cambios de valor en los últimos años

En promedio:
787.996 bn
Mínimo:
325.626 bn
1 ene 1991 año
Máximo:
1.553 billones
1 ene 2016 año
A la fecha de observación
Valor
Cambio absoluto
El cambio con respecto al valor anterior
1 ene 1991 año
325.626 bn
+325.626 bn
0.0%
1 ene 1992 año
339.368 bn
+13.742 bn
4.22%
1 ene 1993 año
368.263 bn
+28.895 bn
8.51%
1 ene 1994 año
407.884 bn
+39.621 bn
10.76%
1 ene 1995 año
389.932 bn
-17.952 bn
-4.4%
1 ene 1996 año
429.342 bn
+39.41 bn
10.11%
1 ene 1997 año
468.789 bn
+39.447 bn
9.19%
1 ene 1998 año
512.15 bn
+43.361 bn
9.25%
1 ene 1999 año
537.424 bn
+25.274 bn
4.93%
1 ene 2000 año
524.85 bn
-12.574 bn
-2.34%
1 ene 2001 año
582.51 bn
+57.66 bn
10.99%
1 ene 2002 año
565.521 bn
-16.989 bn
-2.92%
1 ene 2003 año
581.161 bn
+15.641 bn
2.77%
1 ene 2004 año
605.419 bn
+24.257 bn
4.17%
1 ene 2005 año
695.46 bn
+90.041 bn
14.87%
1 ene 2006 año
768.901 bn
+73.441 bn
10.56%
1 ene 2007 año
890.342 bn
+121.44 bn
15.79%
1 ene 2008 año
979.507 bn
+89.166 bn
10.01%
1 ene 2009 año
1.069 billones
+89.45 bn
9.13%
1 ene 2010 año
1.041 billones
-27.817 bn
-2.6%
1 ene 2011 año
1.185 billones
+144.359 bn
13.87%
1 ene 2012 año
1.331 billones
+145.077 bn
12.24%
1 ene 2013 año
1.378 billones
+47.036 bn
3.53%
1 ene 2014 año
1.45 billones
+72.796 bn
5.28%
1 ene 2015 año
1.508 billones
+57.707 bn
3.98%
1 ene 2016 año
1.553 billones
+45.018 bn
2.99%

Ranking de los países por los datos estadísticos actuales