33
/es/
AIzaSyAYiBZKx7MnpbEhh9jyipgxe19OcubqV5w
August 1, 2025
185207
Madagascar
MDG
true
2
1
GNI, PPP (current international $)
2016,2015,2014,2013,2012,2011,2010,2009,2008,2007,2006,2005,2004,2003,2002,2001,2000,1999,1998,1997,1996,1995,1994,1993,1992,1991
Download
Estadísticas Globales de la Biblioteca →Madagascar →

GNI, PPP (current international $)

Estas estadísticas en otros países:

AfghanistanAlbaniaAlgeriaAngolaAntigua and BarbudaArab WorldArgentinaArmeniaAustraliaAustriaAzerbaijanBahamas, TheBahrainBangladeshBarbadosBelarusBelgiumBelizeBeninBermudaBhutanBoliviaBosnia and HerzegovinaBotswanaBrazilBrunei DarussalamBulgariaBurkina FasoBurundiCabo VerdeCambodiaCameroonCanadaCaribbean small statesCentral African RepublicCentral Europe and the BalticsChadChileChinaColombiaComorosCongo, Dem. Rep.Congo, Rep.Costa RicaCote d'IvoireCroatiaCubaCyprusCzech RepublicDenmarkDjiboutiDominicaDominican RepublicEarly-demographic dividendEast Asia & PacificEast Asia & Pacific (excluding high income)East Asia & Pacific (IDA & IBRD countries)EcuadorEgypt, Arab Rep.El SalvadorEquatorial GuineaEritreaEstoniaEthiopiaEuro areaEurope & Central AsiaEurope & Central Asia (excluding high income)Europe & Central Asia (IDA & IBRD countries)European UnionFijiFinlandFragile and conflict affected situationsFranceGabonGambia, TheGeorgiaGermanyGhanaGreeceGrenadaGuatemalaGuineaGuinea-BissauGuyanaHaitiHeavily indebted poor countries (HIPC)High incomeHondurasHong Kong SAR, ChinaHungaryIBRD onlyIcelandIDA & IBRD totalIDA blendIDA onlyIDA totalIndiaIndonesiaIran, Islamic Rep.IraqIrelandIsraelItalyJamaicaJapanJordanKazakhstanKenyaKiribatiKorea, Rep.KosovoKuwaitKyrgyz RepublicLao PDRLate-demographic dividendLatin America & Caribbean Latin America & Caribbean (excluding high income)Latin America & the Caribbean (IDA & IBRD countries)LatviaLeast developed countries: UN classificationLebanonLesothoLiberiaLibyaLithuaniaLow & middle incomeLow incomeLower middle incomeLuxembourgMacao SAR, ChinaMacedonia, FYRMadagascarMalawiMalaysiaMaldivesMaliMaltaMarshall IslandsMauritaniaMauritiusMexicoMicronesia, Fed. Sts.Middle East & North AfricaMiddle East & North Africa (excluding high income)Middle East & North Africa (IDA & IBRD countries)Middle incomeMoldovaMongoliaMontenegroMoroccoMozambiqueMyanmarNamibiaNauruNepalNetherlandsNew ZealandNicaraguaNigerNigeriaNorth AmericaNorwayOECD membersOmanOther small statesPacific island small statesPakistanPalauPanamaPapua New GuineaParaguayPeruPhilippinesPolandPortugalPost-demographic dividendPre-demographic dividendPuerto RicoQatarRomaniaRussian FederationRwandaSamoaSao Tome and PrincipeSaudi ArabiaSenegalSerbiaSeychellesSierra LeoneSingaporeSlovak RepublicSloveniaSmall statesSolomon IslandsSouth AfricaSouth AsiaSouth Asia (IDA & IBRD)South SudanSpainSri LankaSt. Kitts and NevisSt. LuciaSt. Vincent and the GrenadinesSub-Saharan Africa Sub-Saharan Africa (excluding high income)Sub-Saharan Africa (IDA & IBRD countries)SudanSurinameSwazilandSwedenSwitzerlandTajikistanTanzaniaThailandTimor-LesteTogoTongaTrinidad and TobagoTunisiaTurkeyTurkmenistanTuvaluUgandaUkraineUnited Arab EmiratesUnited KingdomUnited StatesUpper middle incomeUruguayUzbekistanVanuatuVenezuela, RBVietnamWest Bank and GazaWorldYemen, Rep.ZambiaZimbabwe

línea de tiempo (timeline):

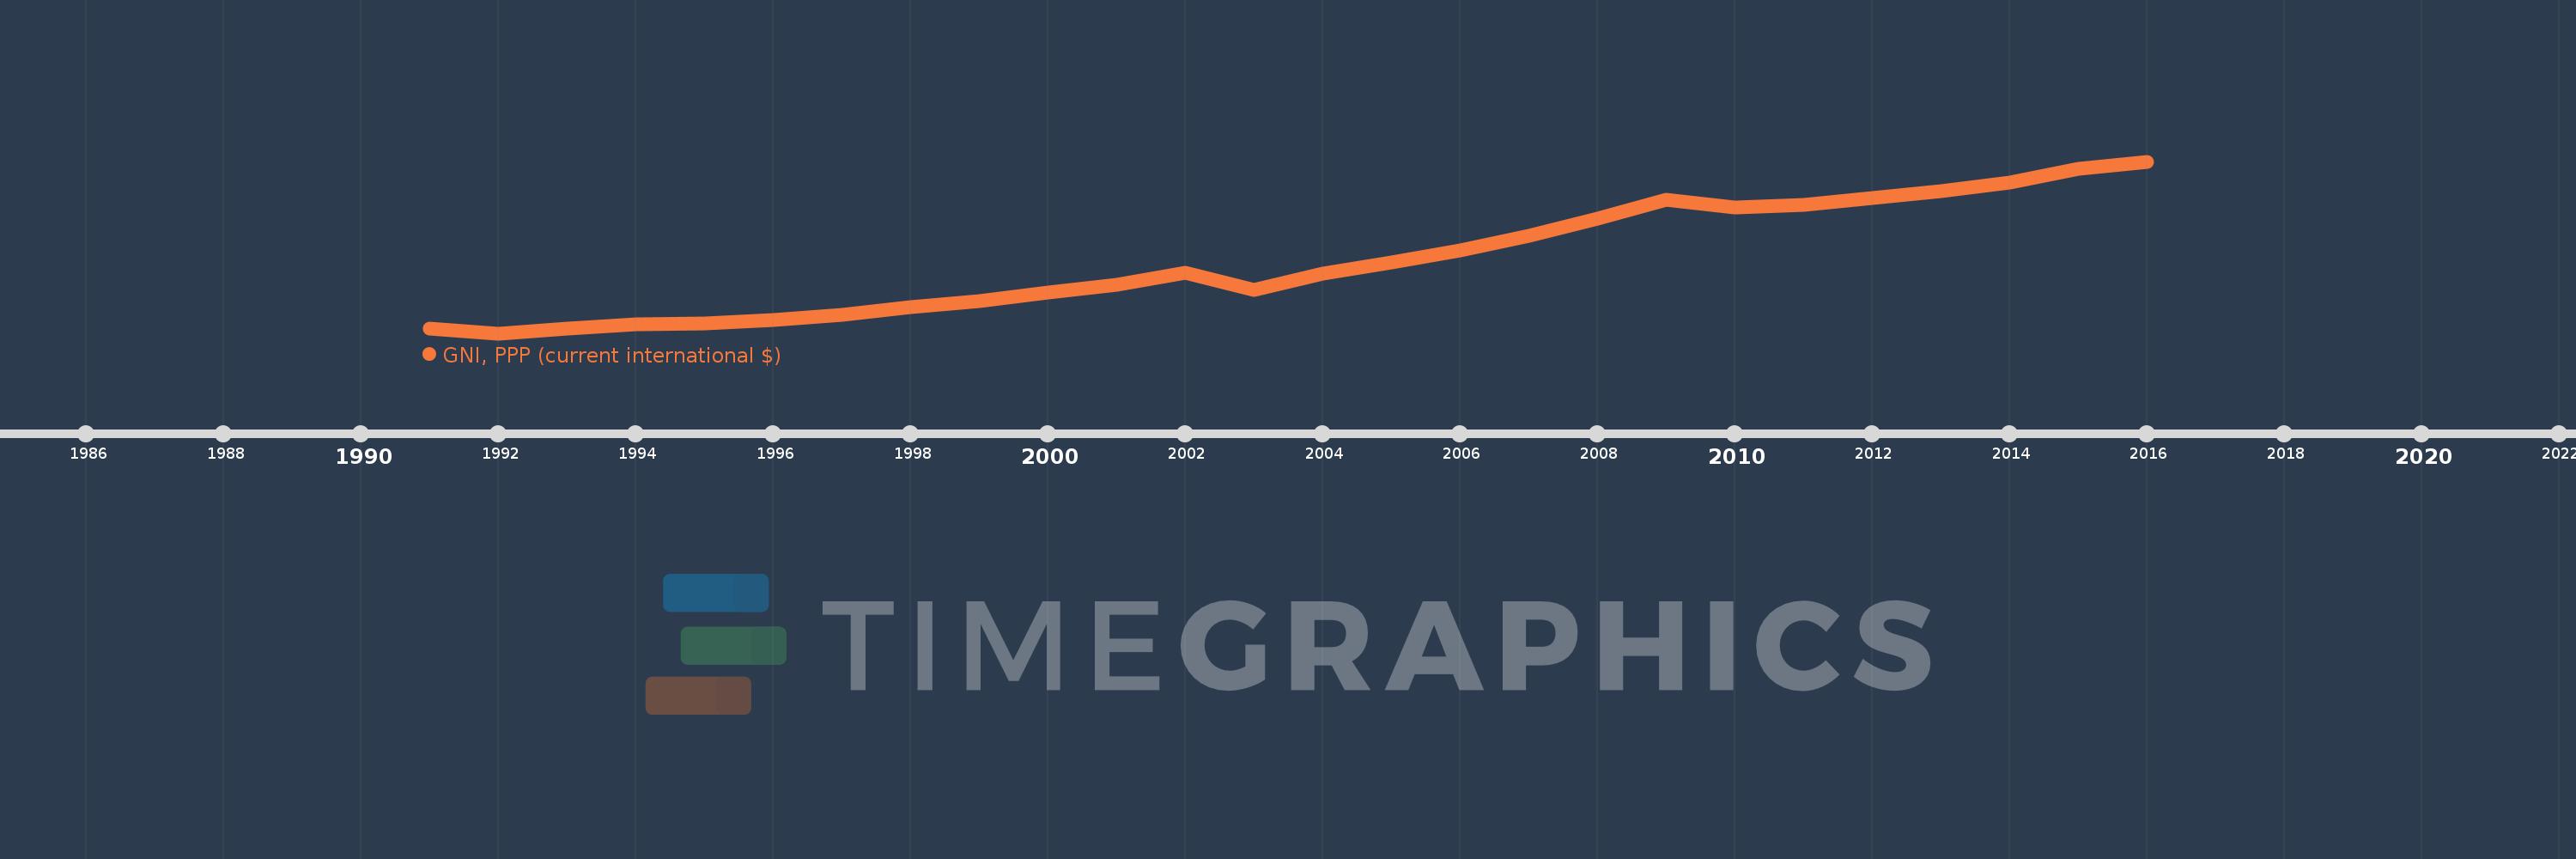
En esta escala de tiempo se presenta un gráfico de 1991 y 2016 de Madagascar. Los datos de 1990 están ausentes. El número de observaciones reales por fecha: 26.

Fuente (nombre):

Indicadores del desarrollo mundial

Fuente (organización):

World Bank, International Comparison Program database.

Categorías:

Economy & Growth

Se ha actualizado:

23 abr 2017 año

Los indicadores de los cambios de valor en los últimos años

En promedio:
20.938 bn
Mínimo:
11.241 bn
1 ene 1992 año
Máximo:
34.142 bn
1 ene 2016 año
A la fecha de observación
Valor
Cambio absoluto
El cambio con respecto al valor anterior
1 ene 1991 año
11.896 bn
+11.896 bn
0.0%
1 ene 1992 año
11.241 bn
-655.002 millones
-5.51%
1 ene 1993 año
11.865 bn
+624.124 millones
5.55%
1 ene 1994 año
12.463 bn
+598.524 millones
5.04%
1 ene 1995 año
12.592 bn
+128.754 millones
1.03%
1 ene 1996 año
13.065 bn
+472.496 millones
3.75%
1 ene 1997 año
13.74 bn
+675.304 millones
5.17%
1 ene 1998 año
14.698 bn
+958.157 millones
6.97%
1 ene 1999 año
15.537 bn
+839.258 millones
5.71%
1 ene 2000 año
16.653 bn
+1.115 bn
7.18%
1 ene 2001 año
17.718 bn
+1.066 bn
6.4%
1 ene 2002 año
19.312 bn
+1.593 bn
8.99%
1 ene 2003 año
17.069 bn
-2.242 bn
-11.61%
1 ene 2004 año
19.145 bn
+2.076 bn
12.16%
1 ene 2005 año
20.63 bn
+1.485 bn
7.76%
1 ene 2006 año
22.329 bn
+1.698 bn
8.23%
1 ene 2007 año
24.201 bn
+1.873 bn
8.39%
1 ene 2008 año
26.579 bn
+2.378 bn
9.83%
1 ene 2009 año
29.101 bn
+2.522 bn
9.49%
1 ene 2010 año
27.993 bn
-1.108 bn
-3.81%
1 ene 2011 año
28.411 bn
+417.708 millones
1.49%
1 ene 2012 año
29.269 bn
+858.417 millones
3.02%
1 ene 2013 año
30.21 bn
+941.465 millones
3.22%
1 ene 2014 año
31.392 bn
+1.182 bn
3.91%
1 ene 2015 año
33.139 bn
+1.746 bn
5.56%
1 ene 2016 año
34.142 bn
+1.003 bn
3.03%

Ranking de los países por los datos estadísticos actuales