29
/es/
es
AIzaSyAYiBZKx7MnpbEhh9jyipgxe19OcubqV5w
April 1, 2024
65136
Albania
ALB
true
2
1
Net taxes on products (current LCU)
2016,2015,2014,2013,2012,2011,2010,2009,2008,2007,2006,2005,2004,2003,2002,2001,2000,1999,1998,1997
Download
Estadísticas Globales de la Biblioteca →Albania →

Net taxes on products (current LCU)

Estas estadísticas en otros países:
AfghanistanAlbaniaAlgeriaAndorraAntigua and BarbudaArgentinaArmeniaArubaAustraliaAustriaAzerbaijanBahamas, TheBahrainBangladeshBarbadosBelarusBelgiumBelizeBeninBermudaBhutanBoliviaBosnia and HerzegovinaBotswanaBrazilBulgariaBurkina FasoBurundiCabo VerdeCambodiaCameroonCanadaCentral African RepublicChadChileColombiaCongo, Dem. Rep.Costa RicaCroatiaCubaCyprusCzech RepublicDenmarkDjiboutiDominicaDominican RepublicEcuadorEgypt, Arab Rep.El SalvadorEquatorial GuineaEritreaEstoniaEthiopiaFaroe IslandsFijiFinlandFranceGabonGambia, TheGeorgiaGermanyGhanaGreeceGrenadaGuatemalaGuineaGuinea-BissauGuyanaHondurasHong Kong SAR, ChinaHungaryIndiaIndonesiaIran, Islamic Rep.IrelandItalyJamaicaJapanJordanKazakhstanKenyaKiribatiKorea, Rep.KosovoKyrgyz RepublicLao PDRLatviaLebanonLesothoLiberiaLiechtensteinLithuaniaLuxembourgMacao SAR, ChinaMacedonia, FYRMadagascarMalawiMalaysiaMaldivesMaliMarshall IslandsMauritaniaMauritiusMexicoMicronesia, Fed. Sts.MoldovaMongoliaMontenegroMoroccoMozambiqueNamibiaNepalNetherlandsNew ZealandNicaraguaNigerNigeriaNorwayOmanPakistanPalauPanamaPapua New GuineaParaguayPeruPolandPortugalRomaniaRussian FederationRwandaSao Tome and PrincipeSenegalSerbiaSeychellesSierra LeoneSingaporeSlovak RepublicSloveniaSolomon IslandsSomaliaSouth AfricaSpainSri LankaSt. Kitts and NevisSt. LuciaSt. Vincent and the GrenadinesSudanSurinameSwazilandSwedenSwitzerlandSyrian Arab RepublicTajikistanTanzaniaThailandTimor-LesteTongaTrinidad and TobagoTunisiaTurkeyTurkmenistanTuvaluUgandaUkraineUnited KingdomUnited StatesUruguayUzbekistanVanuatuVenezuela, RBVietnamWest Bank and GazaYemen, Rep.ZambiaZimbabwe
línea de tiempo (timeline):
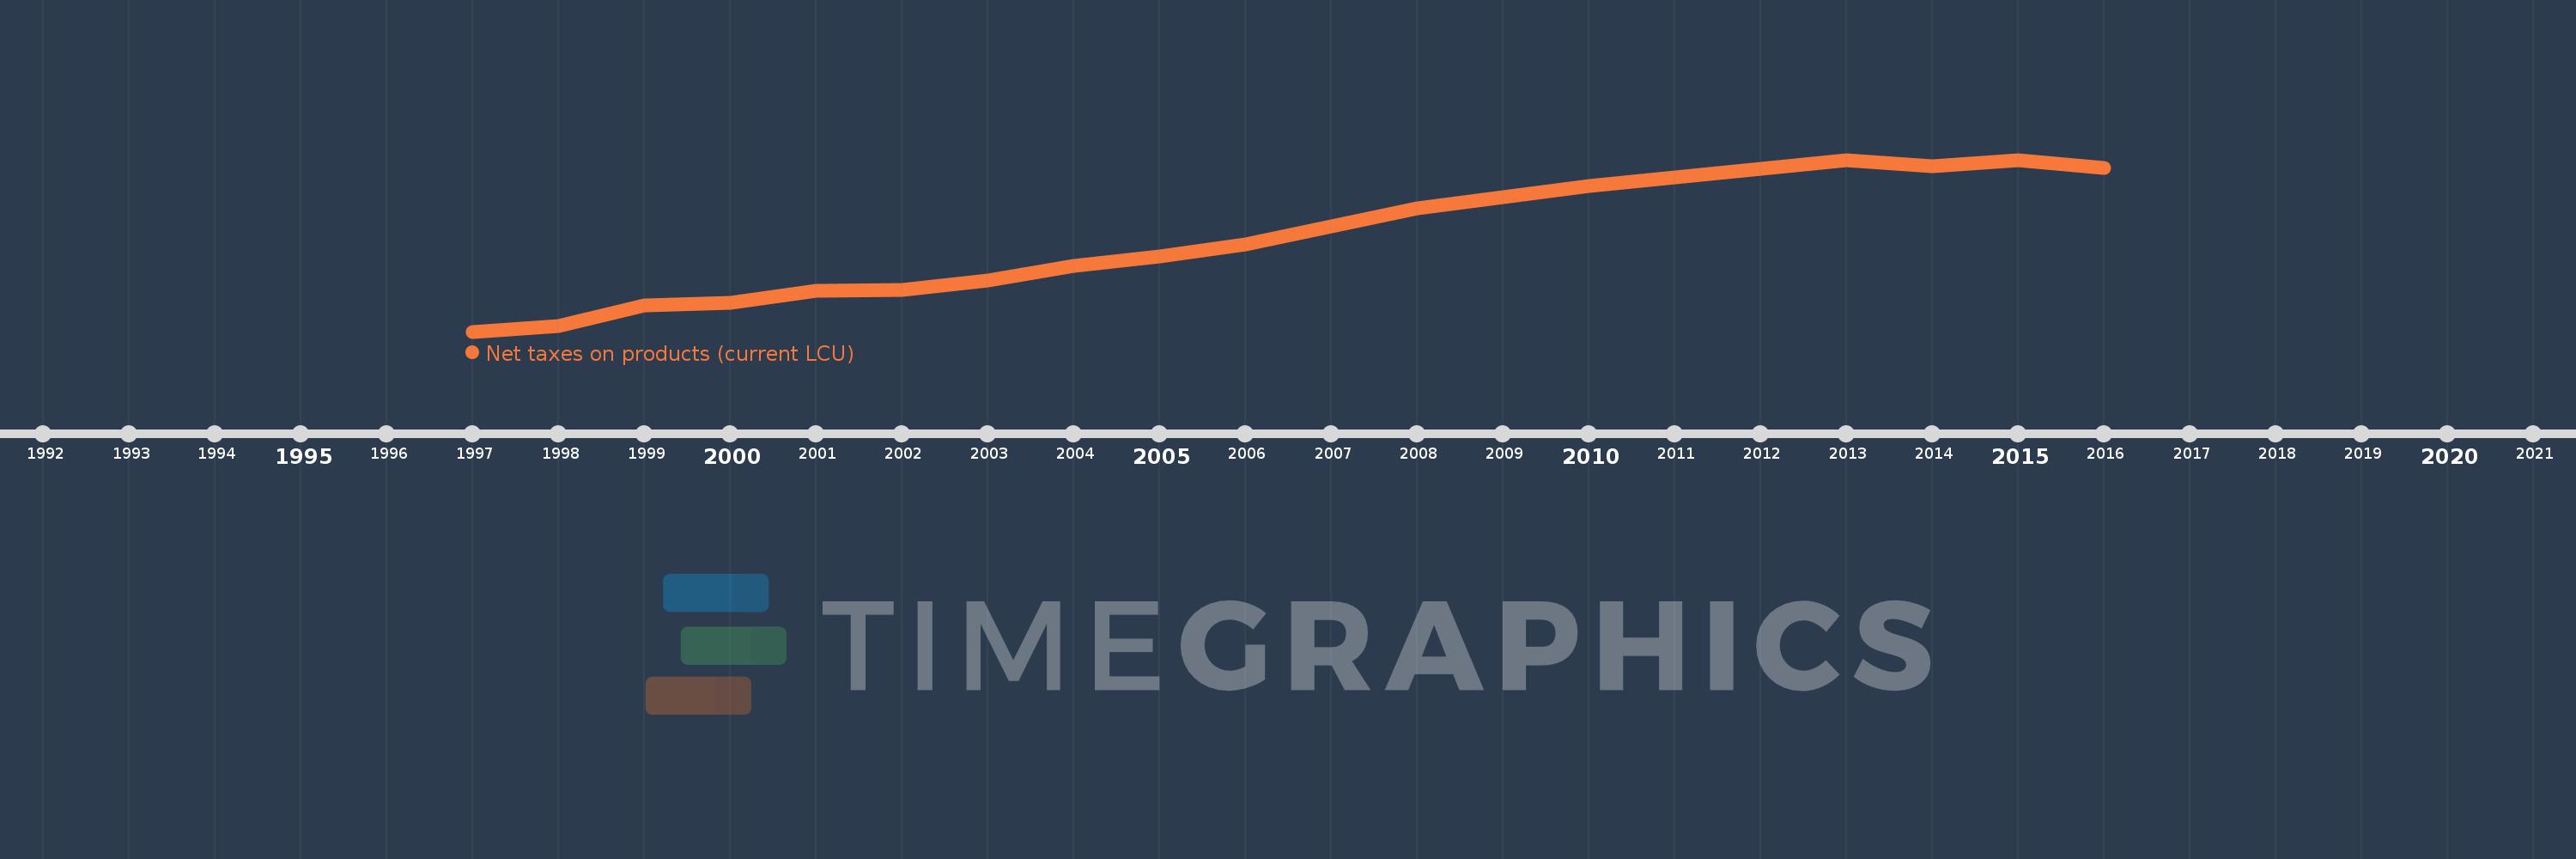
En esta escala de tiempo se presenta un gráfico de 1997 y 2016 de Albania. Los datos de 1996 están ausentes. El número de observaciones reales por fecha: 20.
Fuente (nombre):
Indicadores del desarrollo mundial
Fuente (organización):
World Bank national accounts data, and OECD National Accounts data files.
Categorías:
Economy & Growth
Se ha actualizado:
23 abr 2017 año
Los indicadores de los cambios de valor en los últimos años
En promedio:
108.977 bn
Mínimo:
21.542 bn
1 ene 1997 año
Máximo:
178.064 bn
1 ene 2013 año
A la fecha de observación
Valor
Cambio absoluto
El cambio con respecto al valor anterior
1 ene 1997 año
21.542 bn
+21.542 bn
0.0%
1 ene 1998 año
26.61 bn
+5.068 bn
23.53%
1 ene 1999 año
45.694 bn
+19.084 bn
71.72%
1 ene 2000 año
47.512 bn
+1.818 bn
3.98%
1 ene 2001 año
59.072 bn
+11.56 bn
24.33%
1 ene 2002 año
59.756 bn
+683.502 millones
1.16%
1 ene 2003 año
67.717 bn
+7.961 bn
13.32%
1 ene 2004 año
81.699 bn
+13.983 bn
20.65%
1 ene 2005 año
90.117 bn
+8.418 bn
10.3%
1 ene 2006 año
100.669 bn
+10.552 bn
11.71%
1 ene 2007 año
117.47 bn
+16.801 bn
16.69%
1 ene 2008 año
133.71 bn
+16.24 bn
13.82%
1 ene 2009 año
143.759 bn
+10.048 bn
7.52%
1 ene 2010 año
154.14 bn
+10.382 bn
7.22%
1 ene 2011 año
162.16 bn
+8.02 bn
5.2%
1 ene 2012 año
169.503 bn
+7.343 bn
4.53%
1 ene 2013 año
178.064 bn
+8.561 bn
5.05%
1 ene 2014 año
172.283 bn
-5.781 bn
-3.25%
1 ene 2015 año
177.487 bn
+5.203 bn
3.02%
1 ene 2016 año
170.567 bn
-6.92 bn
-3.9%
Ranking de los países por los datos estadísticos actuales

Comentarios:

Enviar
PremiumAbout & FeedbackAcuerdoPrivacidad
logo
© 2022 Selected Technologies LLC – Morgan Hill, California