33
/es/
AIzaSyAYiBZKx7MnpbEhh9jyipgxe19OcubqV5w
August 1, 2025
276960
United States
USA
true
2
1
Net taxes on products (current LCU)
2015,2014,2013,2012,2011,2010,2009,2008,2007,2006,2005,2004,2003,2002,2001,2000,1999,1998
Download
Estadísticas Globales de la Biblioteca →United States →

Net taxes on products (current LCU)

Estas estadísticas en otros países:

AfghanistanAlbaniaAlgeriaAndorraAntigua and BarbudaArgentinaArmeniaArubaAustraliaAustriaAzerbaijanBahamas, TheBahrainBangladeshBarbadosBelarusBelgiumBelizeBeninBermudaBhutanBoliviaBosnia and HerzegovinaBotswanaBrazilBulgariaBurkina FasoBurundiCabo VerdeCambodiaCameroonCanadaCentral African RepublicChadChileColombiaCongo, Dem. Rep.Costa RicaCroatiaCubaCyprusCzech RepublicDenmarkDjiboutiDominicaDominican RepublicEcuadorEgypt, Arab Rep.El SalvadorEquatorial GuineaEritreaEstoniaEthiopiaFaroe IslandsFijiFinlandFranceGabonGambia, TheGeorgiaGermanyGhanaGreeceGrenadaGuatemalaGuineaGuinea-BissauGuyanaHondurasHong Kong SAR, ChinaHungaryIndiaIndonesiaIran, Islamic Rep.IrelandItalyJamaicaJapanJordanKazakhstanKenyaKiribatiKorea, Rep.KosovoKyrgyz RepublicLao PDRLatviaLebanonLesothoLiberiaLiechtensteinLithuaniaLuxembourgMacao SAR, ChinaMacedonia, FYRMadagascarMalawiMalaysiaMaldivesMaliMarshall IslandsMauritaniaMauritiusMexicoMicronesia, Fed. Sts.MoldovaMongoliaMontenegroMoroccoMozambiqueNamibiaNepalNetherlandsNew ZealandNicaraguaNigerNigeriaNorwayOmanPakistanPalauPanamaPapua New GuineaParaguayPeruPolandPortugalRomaniaRussian FederationRwandaSao Tome and PrincipeSenegalSerbiaSeychellesSierra LeoneSingaporeSlovak RepublicSloveniaSolomon IslandsSomaliaSouth AfricaSpainSri LankaSt. Kitts and NevisSt. LuciaSt. Vincent and the GrenadinesSudanSurinameSwazilandSwedenSwitzerlandSyrian Arab RepublicTajikistanTanzaniaThailandTimor-LesteTongaTrinidad and TobagoTunisiaTurkeyTurkmenistanTuvaluUgandaUkraineUnited KingdomUnited StatesUruguayUzbekistanVanuatuVenezuela, RBVietnamWest Bank and GazaYemen, Rep.ZambiaZimbabwe

línea de tiempo (timeline):

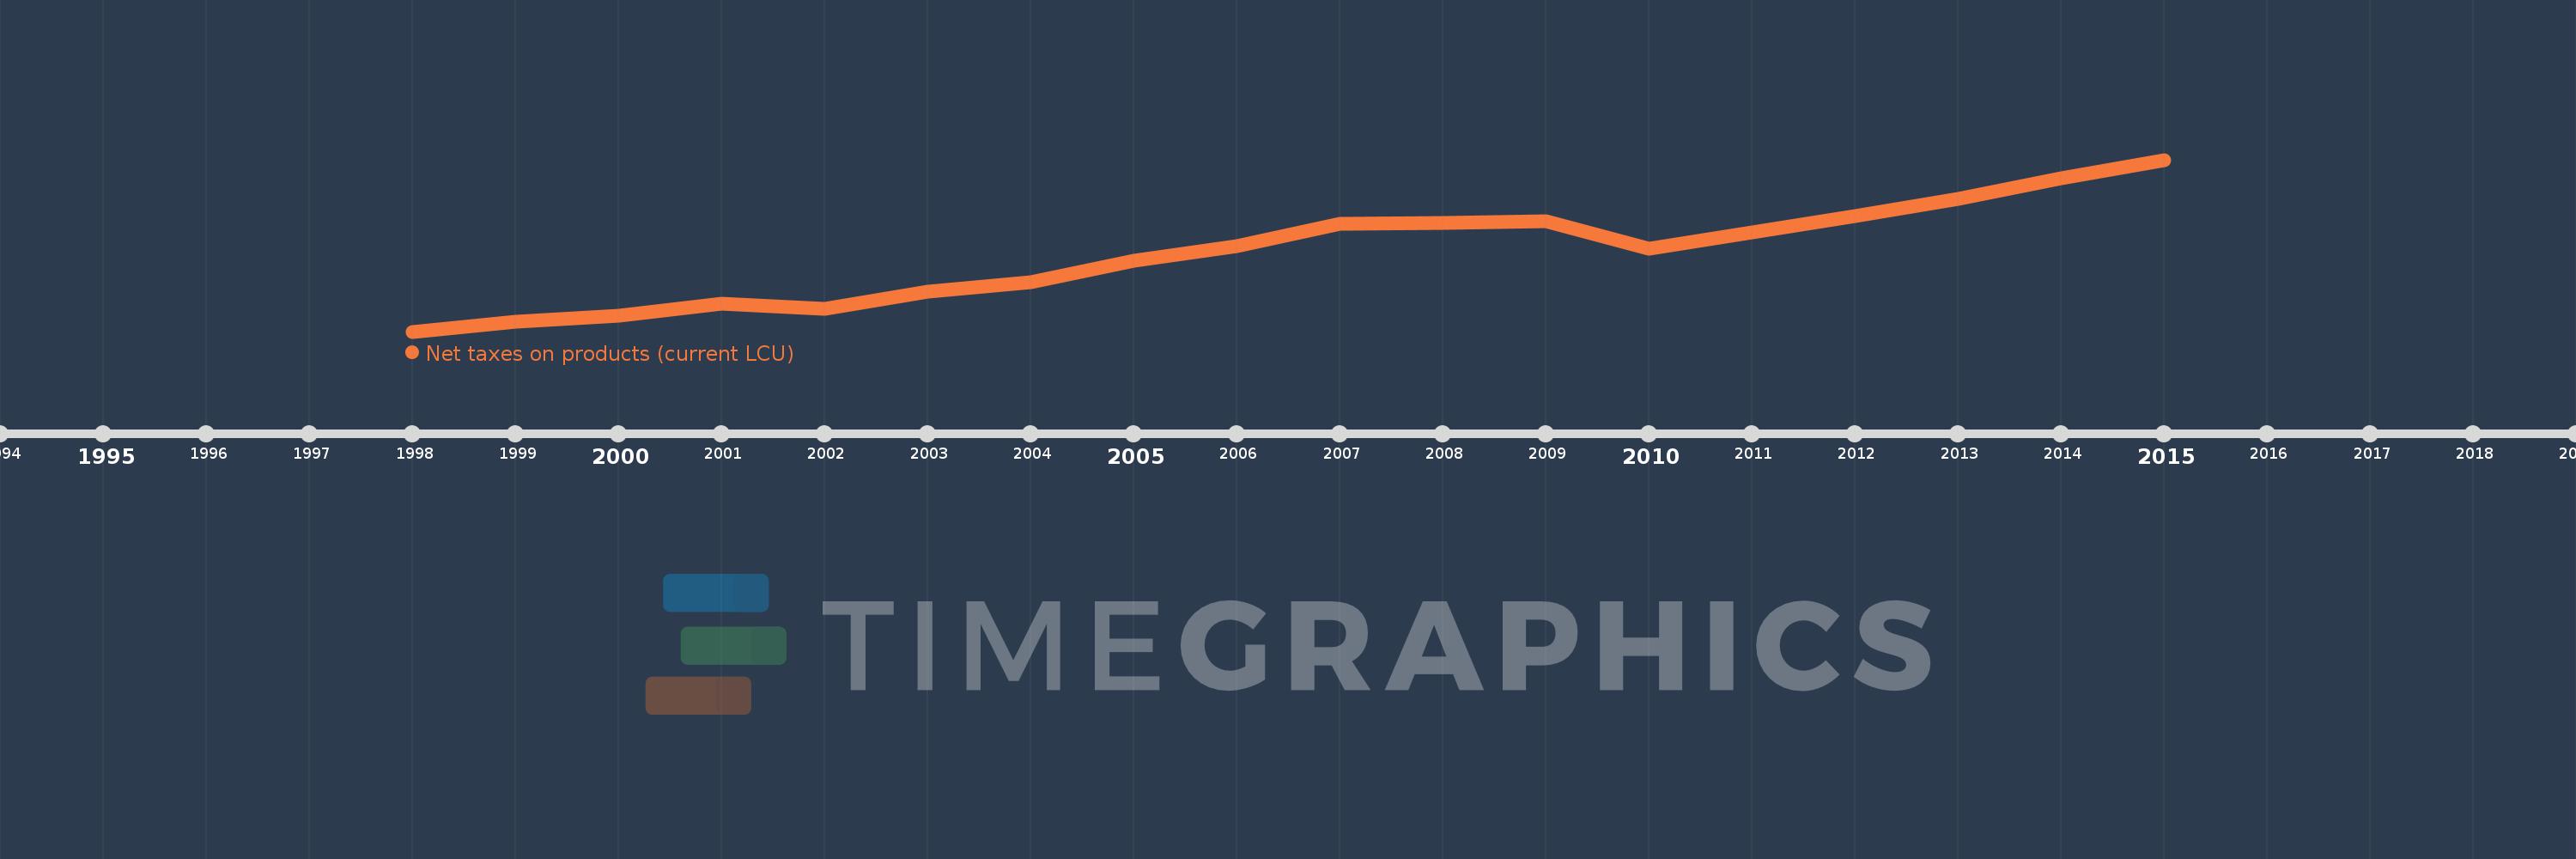
En esta escala de tiempo se presenta un gráfico de 1998 y 2015 de United States. Los datos de 1997 están ausentes. El número de observaciones reales por fecha: 18.

Fuente (nombre):

Indicadores del desarrollo mundial

Fuente (organización):

World Bank national accounts data, and OECD National Accounts data files.

Categorías:

Economy & Growth

Se ha actualizado:

23 abr 2017 año

Los indicadores de los cambios de valor en los últimos años

En promedio:
420.919 bn
Mínimo:
296.773 bn
1 ene 1998 año
Máximo:
569.97 bn
1 ene 2015 año
A la fecha de observación
Valor
Cambio absoluto
El cambio con respecto al valor anterior
1 ene 1998 año
296.773 bn
+296.773 bn
0.0%
1 ene 1999 año
311.937 bn
+15.164 bn
5.11%
1 ene 2000 año
322.509 bn
+10.572 bn
3.39%
1 ene 2001 año
341.196 bn
+18.687 bn
5.79%
1 ene 2002 año
333.447 bn
-7.749 bn
-2.27%
1 ene 2003 año
360.866 bn
+27.419 bn
8.22%
1 ene 2004 año
375.972 bn
+15.106 bn
4.19%
1 ene 2005 año
409.655 bn
+33.683 bn
8.96%
1 ene 2006 año
433.286 bn
+23.631 bn
5.77%
1 ene 2007 año
467.876 bn
+34.59 bn
7.98%
1 ene 2008 año
469.642 bn
+1.766 bn
0.38%
1 ene 2009 año
472.563 bn
+2.921 bn
0.62%
1 ene 2010 año
428.265 bn
-44.298 bn
-9.37%
1 ene 2011 año
454.768 bn
+26.503 bn
6.19%
1 ene 2012 año
480.594 bn
+25.826 bn
5.68%
1 ene 2013 año
507.278 bn
+26.684 bn
5.55%
1 ene 2014 año
539.949 bn
+32.671 bn
6.44%
1 ene 2015 año
569.97 bn
+30.021 bn
5.56%

Ranking de los países por los datos estadísticos actuales