33
/es/
AIzaSyAYiBZKx7MnpbEhh9jyipgxe19OcubqV5w
August 1, 2025
258711
Syrian Arab Republic
SYR
true
2
1
Net taxes on products (current LCU)
2003,2002,2001,2000,1999,1998,1997,1996,1995,1994,1993,1992,1991
Download
Estadísticas Globales de la Biblioteca →Syrian Arab Republic →

Net taxes on products (current LCU)

Estas estadísticas en otros países:

AfghanistanAlbaniaAlgeriaAndorraAntigua and BarbudaArgentinaArmeniaArubaAustraliaAustriaAzerbaijanBahamas, TheBahrainBangladeshBarbadosBelarusBelgiumBelizeBeninBermudaBhutanBoliviaBosnia and HerzegovinaBotswanaBrazilBulgariaBurkina FasoBurundiCabo VerdeCambodiaCameroonCanadaCentral African RepublicChadChileColombiaCongo, Dem. Rep.Costa RicaCroatiaCubaCyprusCzech RepublicDenmarkDjiboutiDominicaDominican RepublicEcuadorEgypt, Arab Rep.El SalvadorEquatorial GuineaEritreaEstoniaEthiopiaFaroe IslandsFijiFinlandFranceGabonGambia, TheGeorgiaGermanyGhanaGreeceGrenadaGuatemalaGuineaGuinea-BissauGuyanaHondurasHong Kong SAR, ChinaHungaryIndiaIndonesiaIran, Islamic Rep.IrelandItalyJamaicaJapanJordanKazakhstanKenyaKiribatiKorea, Rep.KosovoKyrgyz RepublicLao PDRLatviaLebanonLesothoLiberiaLiechtensteinLithuaniaLuxembourgMacao SAR, ChinaMacedonia, FYRMadagascarMalawiMalaysiaMaldivesMaliMarshall IslandsMauritaniaMauritiusMexicoMicronesia, Fed. Sts.MoldovaMongoliaMontenegroMoroccoMozambiqueNamibiaNepalNetherlandsNew ZealandNicaraguaNigerNigeriaNorwayOmanPakistanPalauPanamaPapua New GuineaParaguayPeruPolandPortugalRomaniaRussian FederationRwandaSao Tome and PrincipeSenegalSerbiaSeychellesSierra LeoneSingaporeSlovak RepublicSloveniaSolomon IslandsSomaliaSouth AfricaSpainSri LankaSt. Kitts and NevisSt. LuciaSt. Vincent and the GrenadinesSudanSurinameSwazilandSwedenSwitzerlandSyrian Arab RepublicTajikistanTanzaniaThailandTimor-LesteTongaTrinidad and TobagoTunisiaTurkeyTurkmenistanTuvaluUgandaUkraineUnited KingdomUnited StatesUruguayUzbekistanVanuatuVenezuela, RBVietnamWest Bank and GazaYemen, Rep.ZambiaZimbabwe

línea de tiempo (timeline):

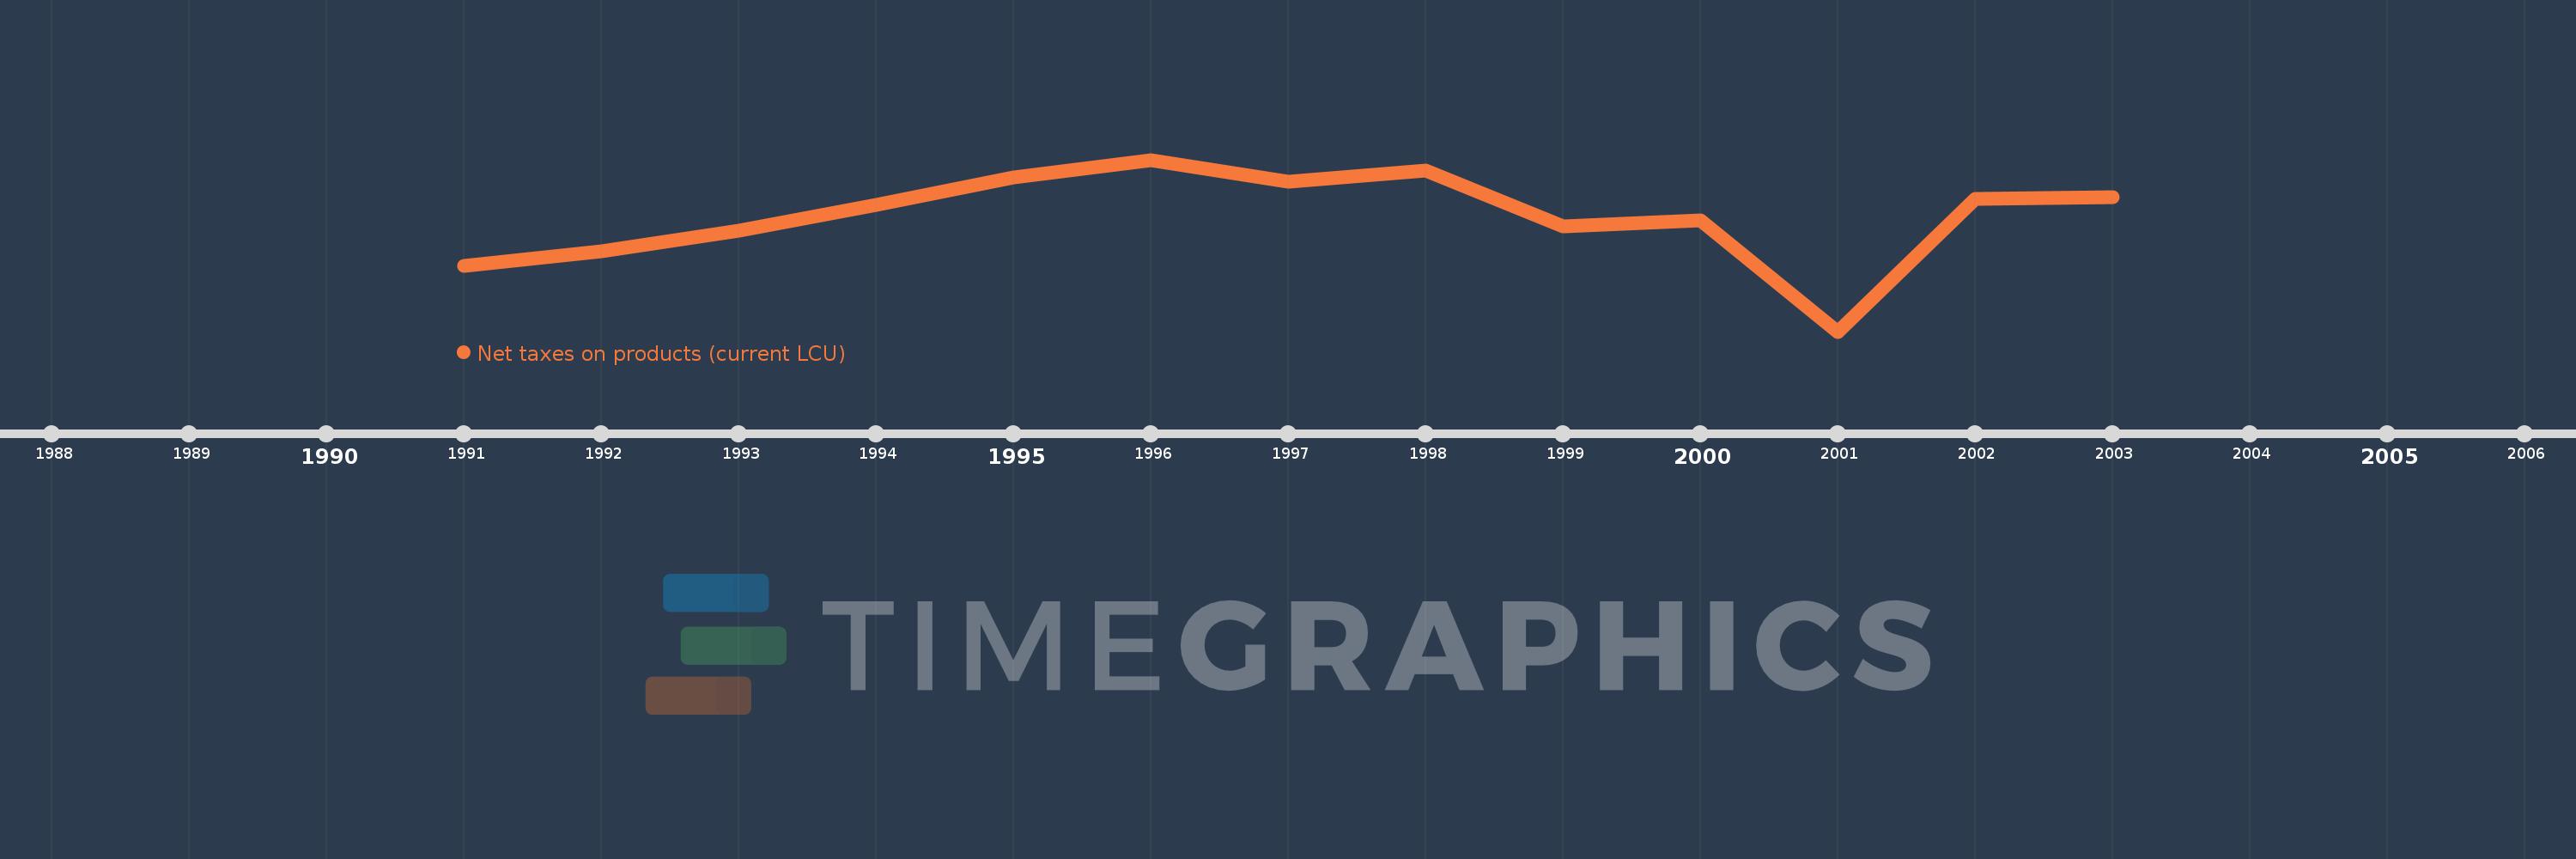
En esta escala de tiempo se presenta un gráfico de 1991 y 2003 de Syrian Arab Republic. Los datos de 1990 están ausentes. El número de observaciones reales por fecha: 13.

Fuente (nombre):

Indicadores del desarrollo mundial

Fuente (organización):

World Bank national accounts data, and OECD National Accounts data files.

Categorías:

Economy & Growth

Se ha actualizado:

23 abr 2017 año

Los indicadores de los cambios de valor en los últimos años

En promedio:
35.746 bn
Mínimo:
-15.26 bn
1 ene 2001 año
Máximo:
61.004 bn
1 ene 1996 año
A la fecha de observación
Valor
Cambio absoluto
El cambio con respecto al valor anterior
1 ene 1991 año
13.749 bn
+13.749 bn
0.0%
1 ene 1992 año
20.532 bn
+6.783 bn
49.33%
1 ene 1993 año
29.405 bn
+8.873 bn
43.22%
1 ene 1994 año
40.811 bn
+11.406 bn
38.79%
1 ene 1995 año
53.046 bn
+12.235 bn
29.98%
1 ene 1996 año
61.004 bn
+7.958 bn
15.0%
1 ene 1997 año
51.413 bn
-9.591 bn
-15.72%
1 ene 1998 año
56.327 bn
+4.914 bn
9.56%
1 ene 1999 año
31.474 bn
-24.853 bn
-44.12%
1 ene 2000 año
34.034 bn
+2.56 bn
8.13%
1 ene 2001 año
-15.26 bn
-49.294 bn
-144.84%
1 ene 2002 año
43.723 bn
+58.983 bn
-386.52%
1 ene 2003 año
44.439 bn
+716.0 millones
1.64%

Ranking de los países por los datos estadísticos actuales