29
/es/
es
AIzaSyAYiBZKx7MnpbEhh9jyipgxe19OcubqV5w
April 1, 2024
237520
Serbia
SRB
true
2
1
Net taxes on products (current LCU)
2016,2015,2014,2013,2012,2011,2010,2009,2008,2007,2006,2005,2004,2003,2002,2001,2000,1999,1998,1997,1996
Download
Estadísticas Globales de la Biblioteca →Serbia →

Net taxes on products (current LCU)

Estas estadísticas en otros países:
AfghanistanAlbaniaAlgeriaAndorraAntigua and BarbudaArgentinaArmeniaArubaAustraliaAustriaAzerbaijanBahamas, TheBahrainBangladeshBarbadosBelarusBelgiumBelizeBeninBermudaBhutanBoliviaBosnia and HerzegovinaBotswanaBrazilBulgariaBurkina FasoBurundiCabo VerdeCambodiaCameroonCanadaCentral African RepublicChadChileColombiaCongo, Dem. Rep.Costa RicaCroatiaCubaCyprusCzech RepublicDenmarkDjiboutiDominicaDominican RepublicEcuadorEgypt, Arab Rep.El SalvadorEquatorial GuineaEritreaEstoniaEthiopiaFaroe IslandsFijiFinlandFranceGabonGambia, TheGeorgiaGermanyGhanaGreeceGrenadaGuatemalaGuineaGuinea-BissauGuyanaHondurasHong Kong SAR, ChinaHungaryIndiaIndonesiaIran, Islamic Rep.IrelandItalyJamaicaJapanJordanKazakhstanKenyaKiribatiKorea, Rep.KosovoKyrgyz RepublicLao PDRLatviaLebanonLesothoLiberiaLiechtensteinLithuaniaLuxembourgMacao SAR, ChinaMacedonia, FYRMadagascarMalawiMalaysiaMaldivesMaliMarshall IslandsMauritaniaMauritiusMexicoMicronesia, Fed. Sts.MoldovaMongoliaMontenegroMoroccoMozambiqueNamibiaNepalNetherlandsNew ZealandNicaraguaNigerNigeriaNorwayOmanPakistanPalauPanamaPapua New GuineaParaguayPeruPolandPortugalRomaniaRussian FederationRwandaSao Tome and PrincipeSenegalSerbiaSeychellesSierra LeoneSingaporeSlovak RepublicSloveniaSolomon IslandsSomaliaSouth AfricaSpainSri LankaSt. Kitts and NevisSt. LuciaSt. Vincent and the GrenadinesSudanSurinameSwazilandSwedenSwitzerlandSyrian Arab RepublicTajikistanTanzaniaThailandTimor-LesteTongaTrinidad and TobagoTunisiaTurkeyTurkmenistanTuvaluUgandaUkraineUnited KingdomUnited StatesUruguayUzbekistanVanuatuVenezuela, RBVietnamWest Bank and GazaYemen, Rep.ZambiaZimbabwe
línea de tiempo (timeline):
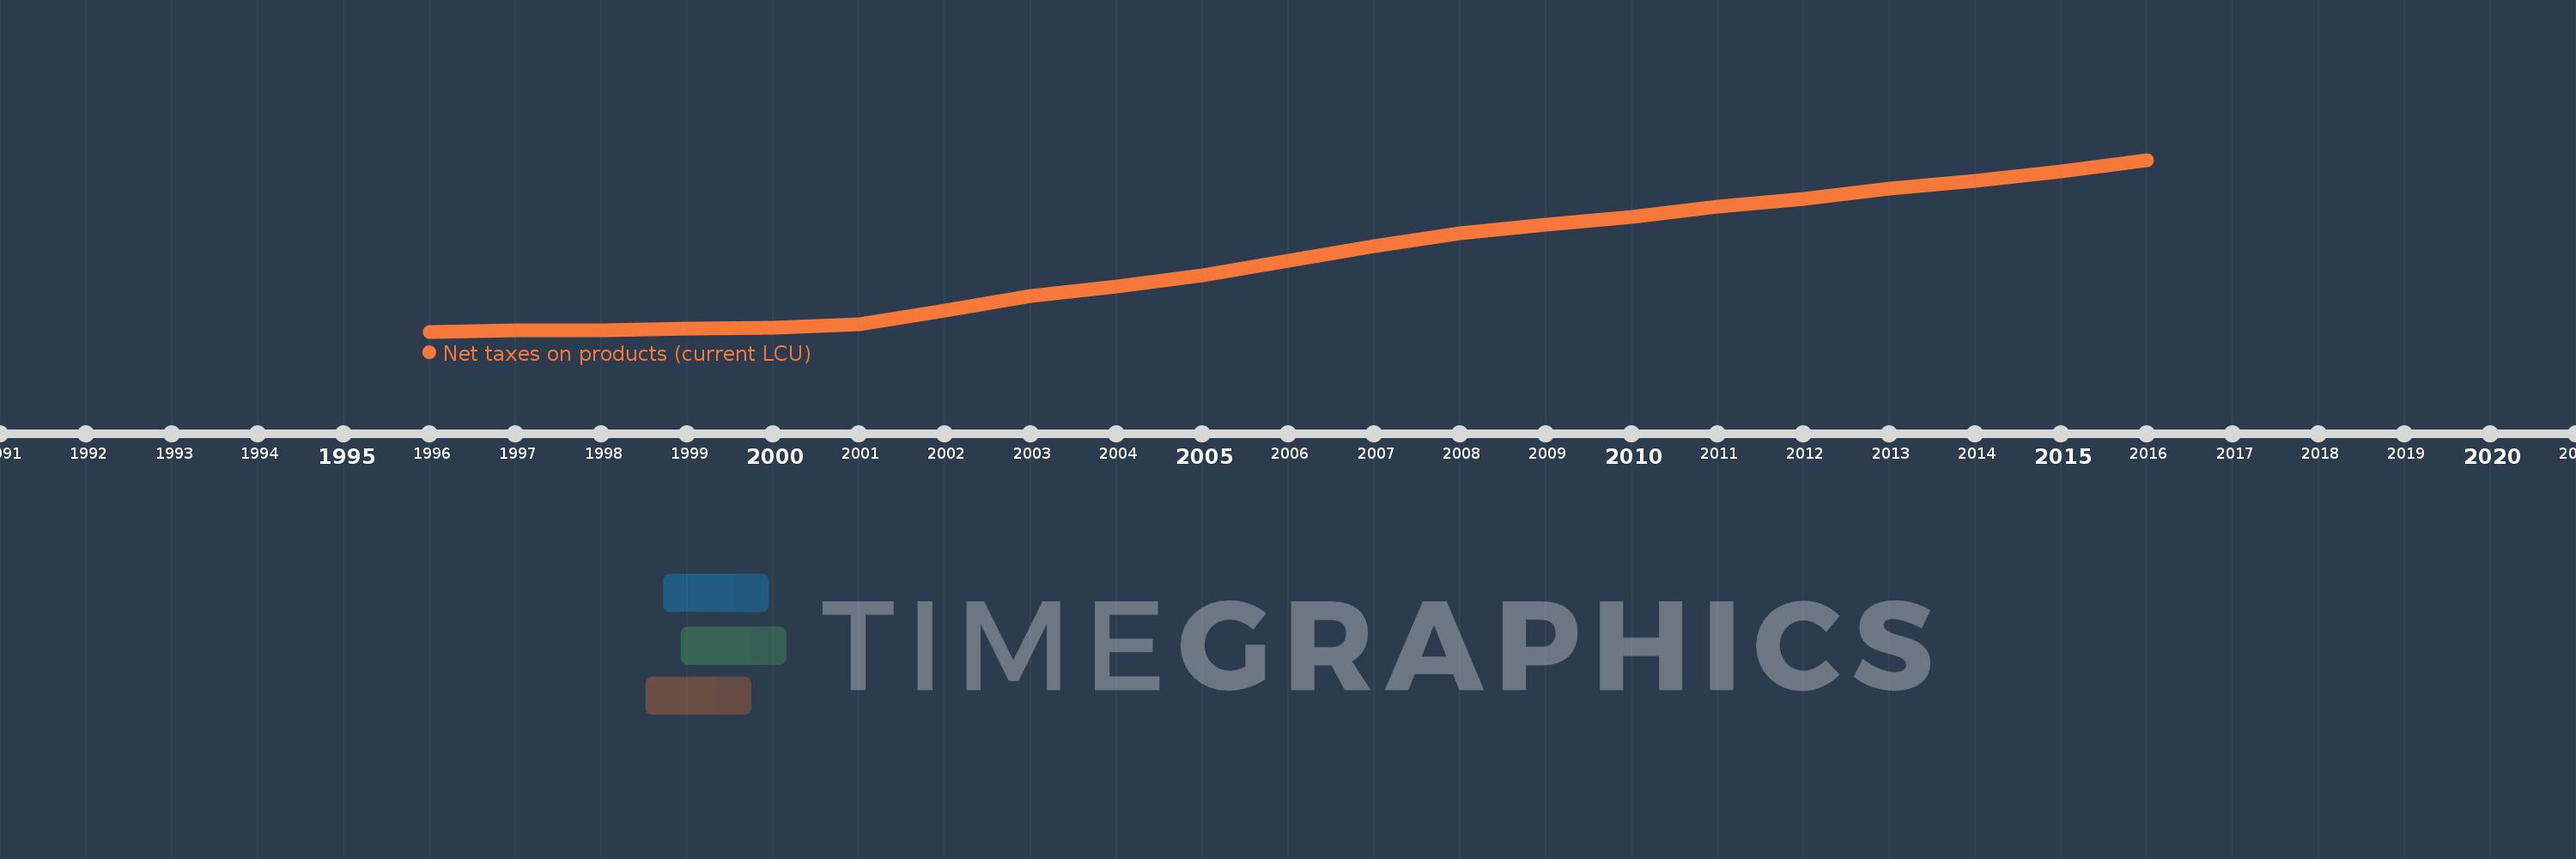
En esta escala de tiempo se presenta un gráfico de 1996 y 2016 de Serbia. Los datos de 1995 están ausentes. El número de observaciones reales por fecha: 21.
Fuente (nombre):
Indicadores del desarrollo mundial
Fuente (organización):
World Bank national accounts data, and OECD National Accounts data files.
Categorías:
Economy & Growth
Se ha actualizado:
23 abr 2017 año
Los indicadores de los cambios de valor en los últimos años
En promedio:
298.697 bn
Mínimo:
3.456 bn
1 ene 1996 año
Máximo:
697.285 bn
1 ene 2016 año
A la fecha de observación
Valor
Cambio absoluto
El cambio con respecto al valor anterior
1 ene 1996 año
3.456 bn
+3.456 bn
0.0%
1 ene 1997 año
7.848 bn
+4.392 bn
127.06%
1 ene 1998 año
10.113 bn
+2.265 bn
28.87%
1 ene 1999 año
15.248 bn
+5.135 bn
50.77%
1 ene 2000 año
17.396 bn
+2.148 bn
14.09%
1 ene 2001 año
33.142 bn
+15.747 bn
90.52%
1 ene 2002 año
88.8 bn
+55.658 bn
167.93%
1 ene 2003 año
147.738 bn
+58.938 bn
66.37%
1 ene 2004 año
187.207 bn
+39.468 bn
26.72%
1 ene 2005 año
230.163 bn
+42.956 bn
22.95%
1 ene 2006 año
290.018 bn
+59.855 bn
26.01%
1 ene 2007 año
348.093 bn
+58.075 bn
20.02%
1 ene 2008 año
400.094 bn
+52.001 bn
14.94%
1 ene 2009 año
437.089 bn
+36.996 bn
9.25%
1 ene 2010 año
467.024 bn
+29.935 bn
6.85%
1 ene 2011 año
509.846 bn
+42.822 bn
9.17%
1 ene 2012 año
538.244 bn
+28.398 bn
5.57%
1 ene 2013 año
579.665 bn
+41.421 bn
7.7%
1 ene 2014 año
612.885 bn
+33.22 bn
5.73%
1 ene 2015 año
651.293 bn
+38.408 bn
6.27%
1 ene 2016 año
697.285 bn
+45.992 bn
7.06%
Ranking de los países por los datos estadísticos actuales

Comentarios:

Enviar
PremiumAbout & FeedbackAcuerdoPrivacidad
logo
© 2022 Selected Technologies LLC – Morgan Hill, California