33
/es/
AIzaSyAYiBZKx7MnpbEhh9jyipgxe19OcubqV5w
August 1, 2025
225211
Poland
POL
true
2
1
Net taxes on products (current LCU)
2016,2015,2014,2013,2012,2011,2010,2009,2008,2007,2006,2005,2004,2003,2002,2001,2000,1999,1998,1997,1996,1995,1994,1993,1992
Download
Estadísticas Globales de la Biblioteca →Poland →

Net taxes on products (current LCU)

Estas estadísticas en otros países:

AfghanistanAlbaniaAlgeriaAndorraAntigua and BarbudaArgentinaArmeniaArubaAustraliaAustriaAzerbaijanBahamas, TheBahrainBangladeshBarbadosBelarusBelgiumBelizeBeninBermudaBhutanBoliviaBosnia and HerzegovinaBotswanaBrazilBulgariaBurkina FasoBurundiCabo VerdeCambodiaCameroonCanadaCentral African RepublicChadChileColombiaCongo, Dem. Rep.Costa RicaCroatiaCubaCyprusCzech RepublicDenmarkDjiboutiDominicaDominican RepublicEcuadorEgypt, Arab Rep.El SalvadorEquatorial GuineaEritreaEstoniaEthiopiaFaroe IslandsFijiFinlandFranceGabonGambia, TheGeorgiaGermanyGhanaGreeceGrenadaGuatemalaGuineaGuinea-BissauGuyanaHondurasHong Kong SAR, ChinaHungaryIndiaIndonesiaIran, Islamic Rep.IrelandItalyJamaicaJapanJordanKazakhstanKenyaKiribatiKorea, Rep.KosovoKyrgyz RepublicLao PDRLatviaLebanonLesothoLiberiaLiechtensteinLithuaniaLuxembourgMacao SAR, ChinaMacedonia, FYRMadagascarMalawiMalaysiaMaldivesMaliMarshall IslandsMauritaniaMauritiusMexicoMicronesia, Fed. Sts.MoldovaMongoliaMontenegroMoroccoMozambiqueNamibiaNepalNetherlandsNew ZealandNicaraguaNigerNigeriaNorwayOmanPakistanPalauPanamaPapua New GuineaParaguayPeruPolandPortugalRomaniaRussian FederationRwandaSao Tome and PrincipeSenegalSerbiaSeychellesSierra LeoneSingaporeSlovak RepublicSloveniaSolomon IslandsSomaliaSouth AfricaSpainSri LankaSt. Kitts and NevisSt. LuciaSt. Vincent and the GrenadinesSudanSurinameSwazilandSwedenSwitzerlandSyrian Arab RepublicTajikistanTanzaniaThailandTimor-LesteTongaTrinidad and TobagoTunisiaTurkeyTurkmenistanTuvaluUgandaUkraineUnited KingdomUnited StatesUruguayUzbekistanVanuatuVenezuela, RBVietnamWest Bank and GazaYemen, Rep.ZambiaZimbabwe

línea de tiempo (timeline):

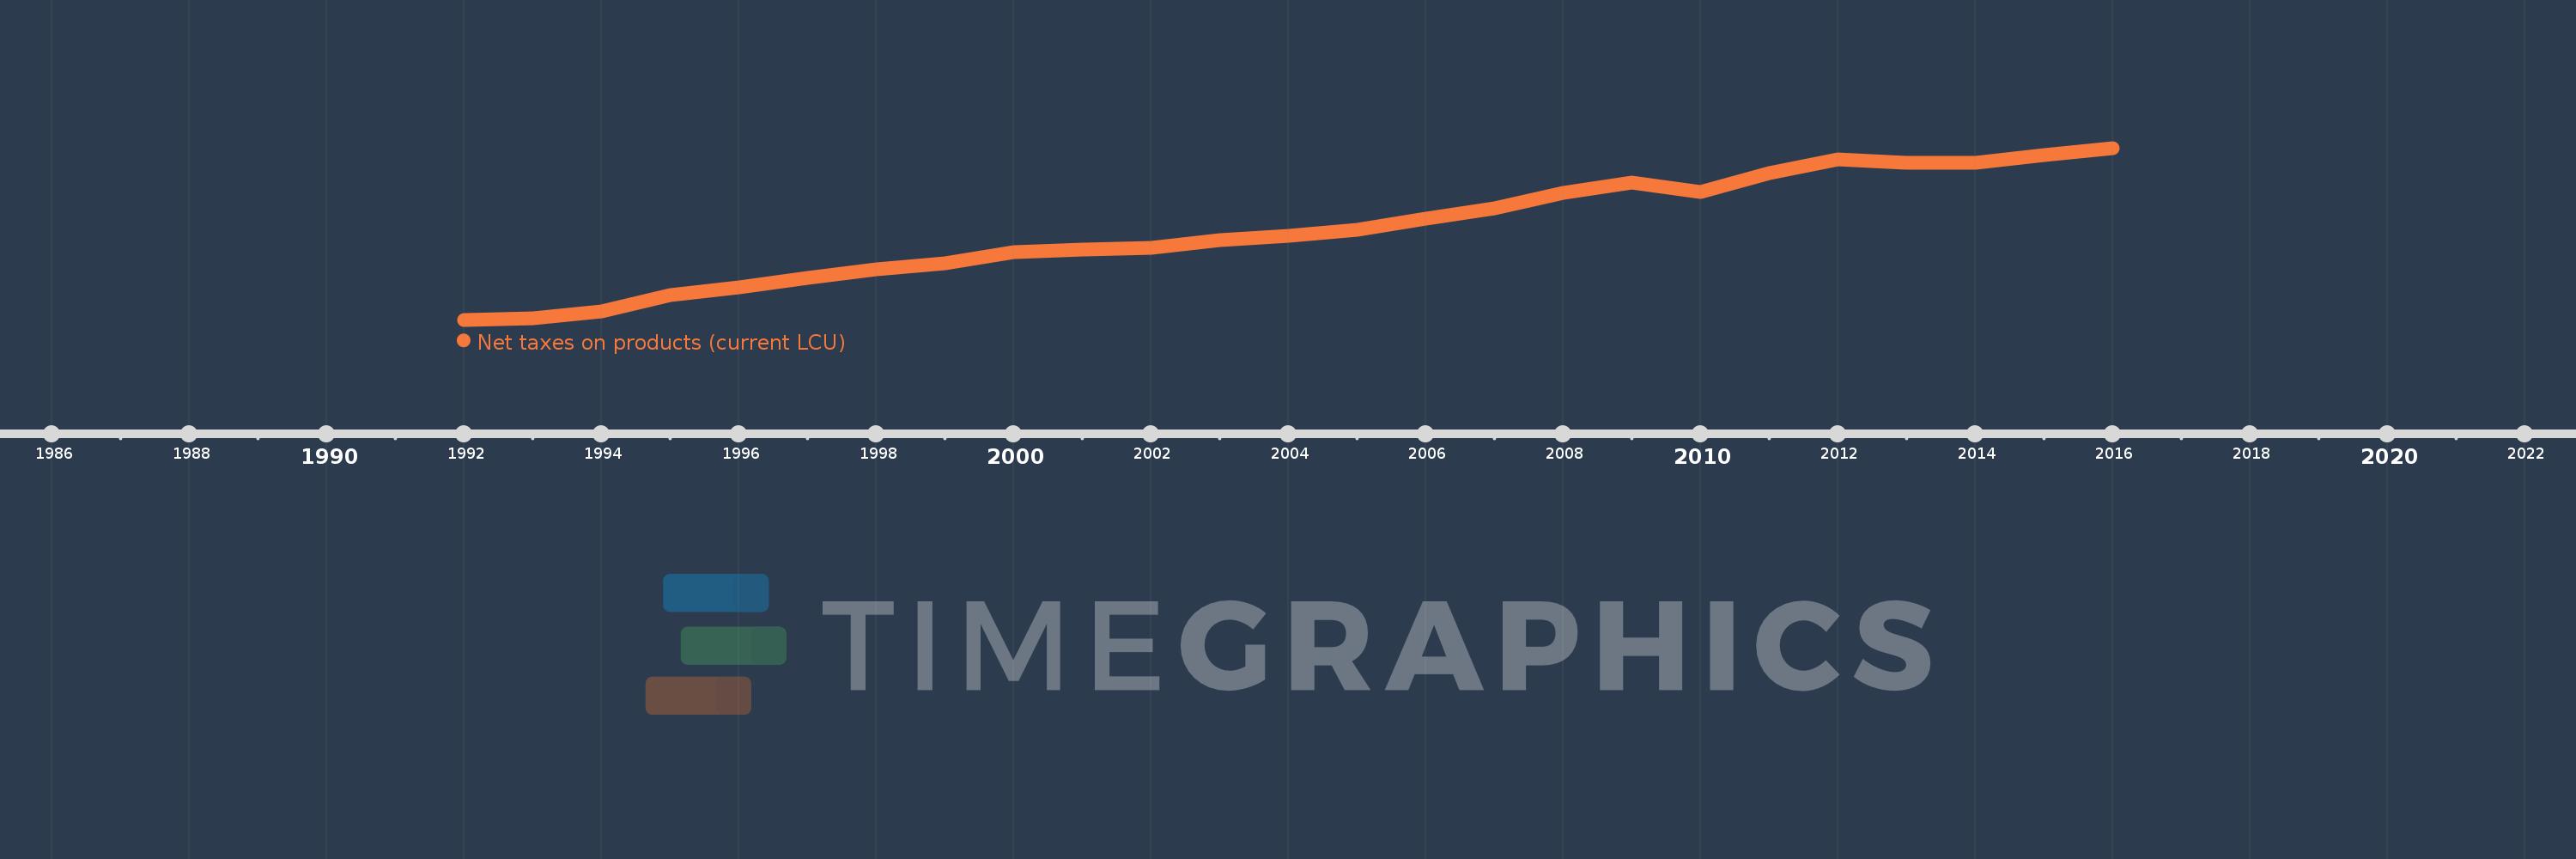
En esta escala de tiempo se presenta un gráfico de 1992 y 2016 de Poland. Los datos de 1991 están ausentes. El número de observaciones reales por fecha: 25.

Fuente (nombre):

Indicadores del desarrollo mundial

Fuente (organización):

World Bank national accounts data, and OECD National Accounts data files.

Categorías:

Economy & Growth

Se ha actualizado:

23 abr 2017 año

Los indicadores de los cambios de valor en los últimos años

En promedio:
107.255 bn
Mínimo:
2.744 bn
1 ene 1992 año
Máximo:
203.026 bn
1 ene 2016 año
A la fecha de observación
Valor
Cambio absoluto
El cambio con respecto al valor anterior
1 ene 1992 año
2.744 bn
+2.744 bn
0.0%
1 ene 1993 año
4.788 bn
+2.044 bn
74.5%
1 ene 1994 año
12.433 bn
+7.646 bn
159.7%
1 ene 1995 año
31.372 bn
+18.939 bn
152.33%
1 ene 1996 año
40.698 bn
+9.326 bn
29.73%
1 ene 1997 año
51.954 bn
+11.256 bn
27.66%
1 ene 1998 año
61.634 bn
+9.68 bn
18.63%
1 ene 1999 año
68.562 bn
+6.928 bn
11.24%
1 ene 2000 año
81.209 bn
+12.647 bn
18.45%
1 ene 2001 año
84.161 bn
+2.952 bn
3.64%
1 ene 2002 año
86.729 bn
+2.568 bn
3.05%
1 ene 2003 año
95.648 bn
+8.919 bn
10.28%
1 ene 2004 año
100.715 bn
+5.067 bn
5.3%
1 ene 2005 año
107.717 bn
+7.002 bn
6.95%
1 ene 2006 año
120.119 bn
+12.402 bn
11.51%
1 ene 2007 año
132.197 bn
+12.078 bn
10.06%
1 ene 2008 año
151.119 bn
+18.922 bn
14.31%
1 ene 2009 año
162.25 bn
+11.131 bn
7.37%
1 ene 2010 año
152.11 bn
-10.14 bn
-6.25%
1 ene 2011 año
173.822 bn
+21.712 bn
14.27%
1 ene 2012 año
189.857 bn
+16.035 bn
9.22%
1 ene 2013 año
185.768 bn
-4.089 bn
-2.15%
1 ene 2014 año
185.978 bn
+210.0 millones
0.11%
1 ene 2015 año
194.764 bn
+8.786 bn
4.72%
1 ene 2016 año
203.026 bn
+8.262 bn
4.24%

Ranking de los países por los datos estadísticos actuales