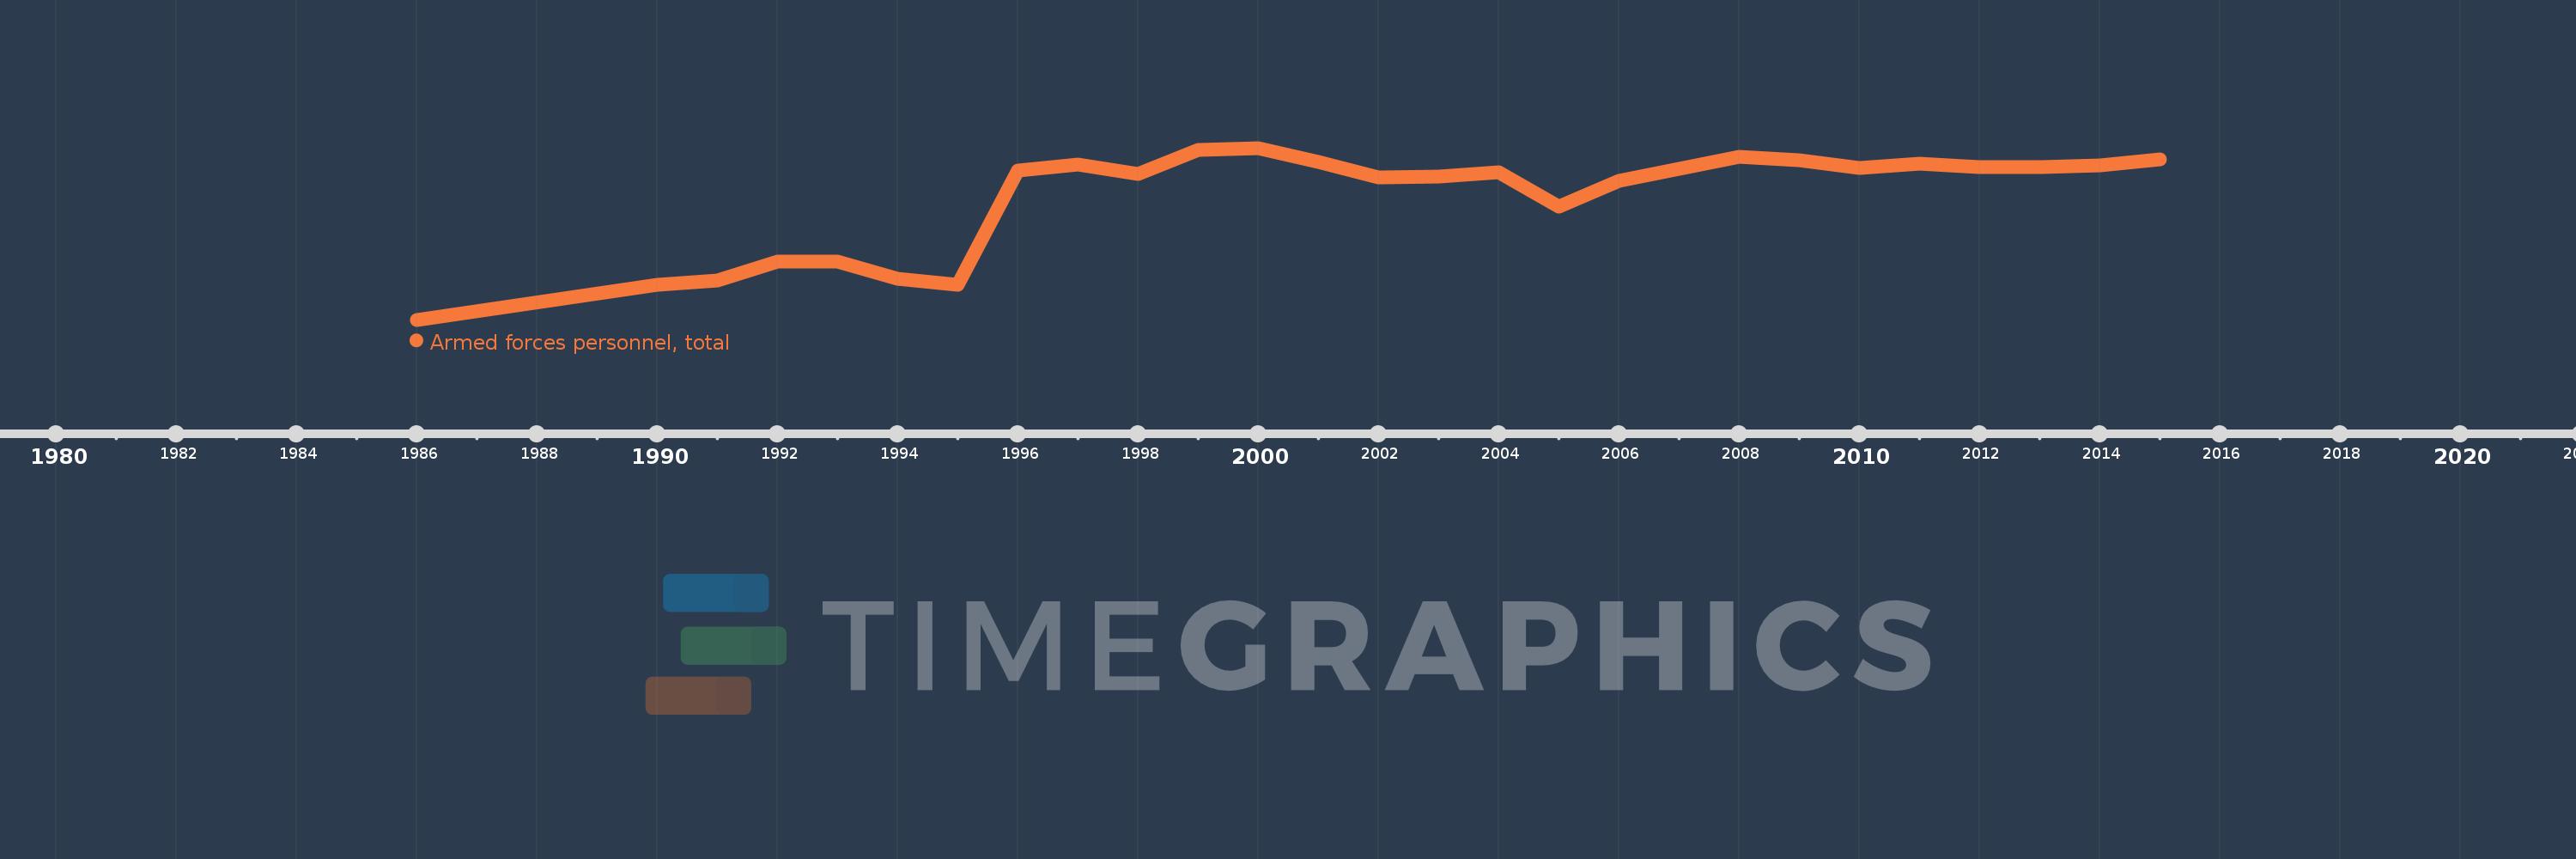
En esta escala de tiempo se presenta un gráfico de 1986 y 2015 de Small states. Los datos de 1985 están ausentes. El número de observaciones reales por fecha: 26.
Fuente (nombre):
Indicadores del desarrollo mundial
Fuente (organización):
International Institute for Strategic Studies, The Military Balance.
Categorías:
Public Sector
Se ha actualizado:
23 abr 2017 año
Los indicadores de los cambios de valor en los últimos años
En promedio:
135.885 mil
Mínimo:
76.93 mil
1 ene 1986 año
Máximo:
160.43 mil
1 ene 2000 año
A la fecha de observación
Valor
Cambio absoluto
El cambio con respecto al valor anterior
1 ene 1986 año
76.93 mil
+76.93 mil
0.0%
1 ene 1990 año
94.0 mil
+17.07 mil
22.19%
1 ene 1991 año
96.0 mil
+2.0 mil
2.13%
1 ene 1992 año
105.0 mil
+9.0 mil
9.38%
1 ene 1993 año
105.0 mil
0.0
0.0%
1 ene 1994 año
97.0 mil
-8.0 mil
-7.62%
1 ene 1995 año
94.0 mil
-3.0 mil
-3.09%
1 ene 1996 año
149.35 mil
+55.35 mil
58.88%
1 ene 1997 año
152.55 mil
+3.2 mil
2.14%
1 ene 1998 año
147.97 mil
-4.58 mil
-3.0%
1 ene 1999 año
159.47 mil
+11.5 mil
7.77%
1 ene 2000 año
160.43 mil
+960.0
0.6%
1 ene 2001 año
153.7 mil
-6.73 mil
-4.19%
1 ene 2002 año
146.3 mil
-7.4 mil
-4.81%
1 ene 2003 año
146.5 mil
+200.0
0.14%
1 ene 2004 año
148.7 mil
+2.2 mil
1.5%
1 ene 2005 año
132.09 mil
-16.61 mil
-11.17%
1 ene 2006 año
144.64 mil
+12.55 mil
9.5%
1 ene 2008 año
155.97 mil
+11.33 mil
7.83%
1 ene 2009 año
154.33 mil
-1.64 mil
-1.05%
1 ene 2010 año
150.821 mil
-3.509 mil
-2.27%
1 ene 2011 año
152.984 mil
+2.163 mil
1.43%
1 ene 2012 año
151.32 mil
-1.664 mil
-1.09%
1 ene 2013 año
151.3 mil
-20.0
-0.01%
1 ene 2014 año
151.87 mil
+570.0
0.38%
1 ene 2015 año
154.79 mil
+2.92 mil
1.92%
Ranking de los países por los datos estadísticos actuales