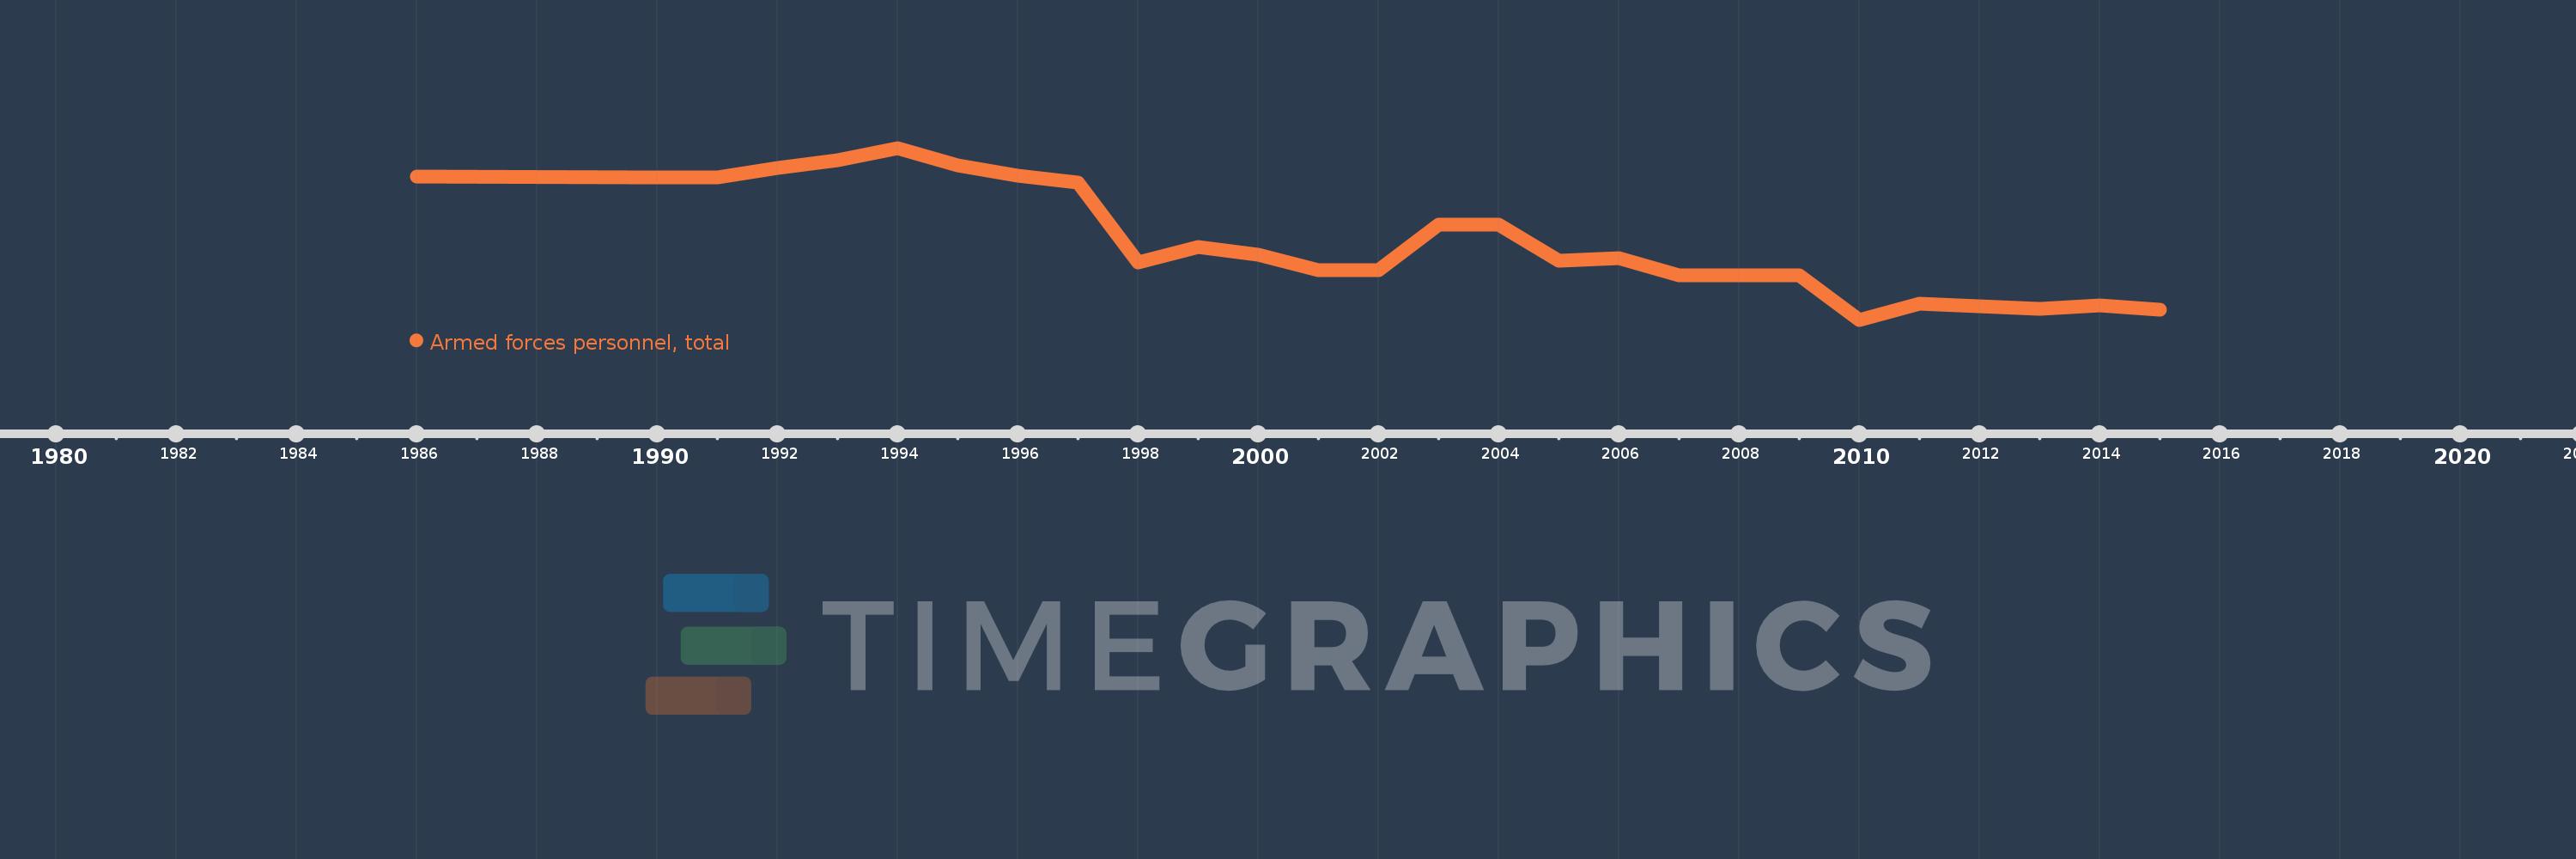
En esta escala de tiempo se presenta un gráfico de 1986 y 2015 de Greece. Los datos de 1985 están ausentes. El número de observaciones reales por fecha: 27.
Fuente (nombre):
Indicadores del desarrollo mundial
Fuente (organización):
International Institute for Strategic Studies, The Military Balance.
Categorías:
Public Sector
Se ha actualizado:
23 abr 2017 año
Los indicadores de los cambios de valor en los últimos años
En promedio:
175.418 mil
Mínimo:
142.936 mil
1 ene 2010 año
Máximo:
213.0 mil
1 ene 1994 año
A la fecha de observación
Valor
Cambio absoluto
El cambio con respecto al valor anterior
1 ene 1986 año
201.5 mil
+201.5 mil
0.0%
1 ene 1990 año
201.0 mil
-500.0
-0.25%
1 ene 1991 año
201.0 mil
0.0
0.0%
1 ene 1992 año
205.0 mil
+4.0 mil
1.99%
1 ene 1993 año
208.0 mil
+3.0 mil
1.46%
1 ene 1994 año
213.0 mil
+5.0 mil
2.4%
1 ene 1995 año
206.0 mil
-7.0 mil
-3.29%
1 ene 1996 año
201.8 mil
-4.2 mil
-2.04%
1 ene 1997 año
198.8 mil
-3.0 mil
-1.49%
1 ene 1998 año
166.3 mil
-32.5 mil
-16.35%
1 ene 1999 año
172.5 mil
+6.2 mil
3.73%
1 ene 2000 año
169.6 mil
-2.9 mil
-1.68%
1 ene 2001 año
163.2 mil
-6.4 mil
-3.77%
1 ene 2002 año
163.2 mil
0.0
0.0%
1 ene 2003 año
181.6 mil
+18.4 mil
11.27%
1 ene 2004 año
181.6 mil
0.0
0.0%
1 ene 2005 año
167.0 mil
-14.6 mil
-8.04%
1 ene 2006 año
168.0 mil
+1000.0
0.6%
1 ene 2007 año
161.0 mil
-7.0 mil
-4.17%
1 ene 2008 año
161.0 mil
0.0
0.0%
1 ene 2009 año
161.0 mil
0.0
0.0%
1 ene 2010 año
142.936 mil
-18.064 mil
-11.22%
1 ene 2011 año
149.647 mil
+6.711 mil
4.7%
1 ene 2012 año
148.35 mil
-1.297 mil
-0.87%
1 ene 2013 año
147.35 mil
-1000.0
-0.67%
1 ene 2014 año
148.95 mil
+1.6 mil
1.09%
1 ene 2015 año
146.95 mil
-2.0 mil
-1.34%
Ranking de los países por los datos estadísticos actuales