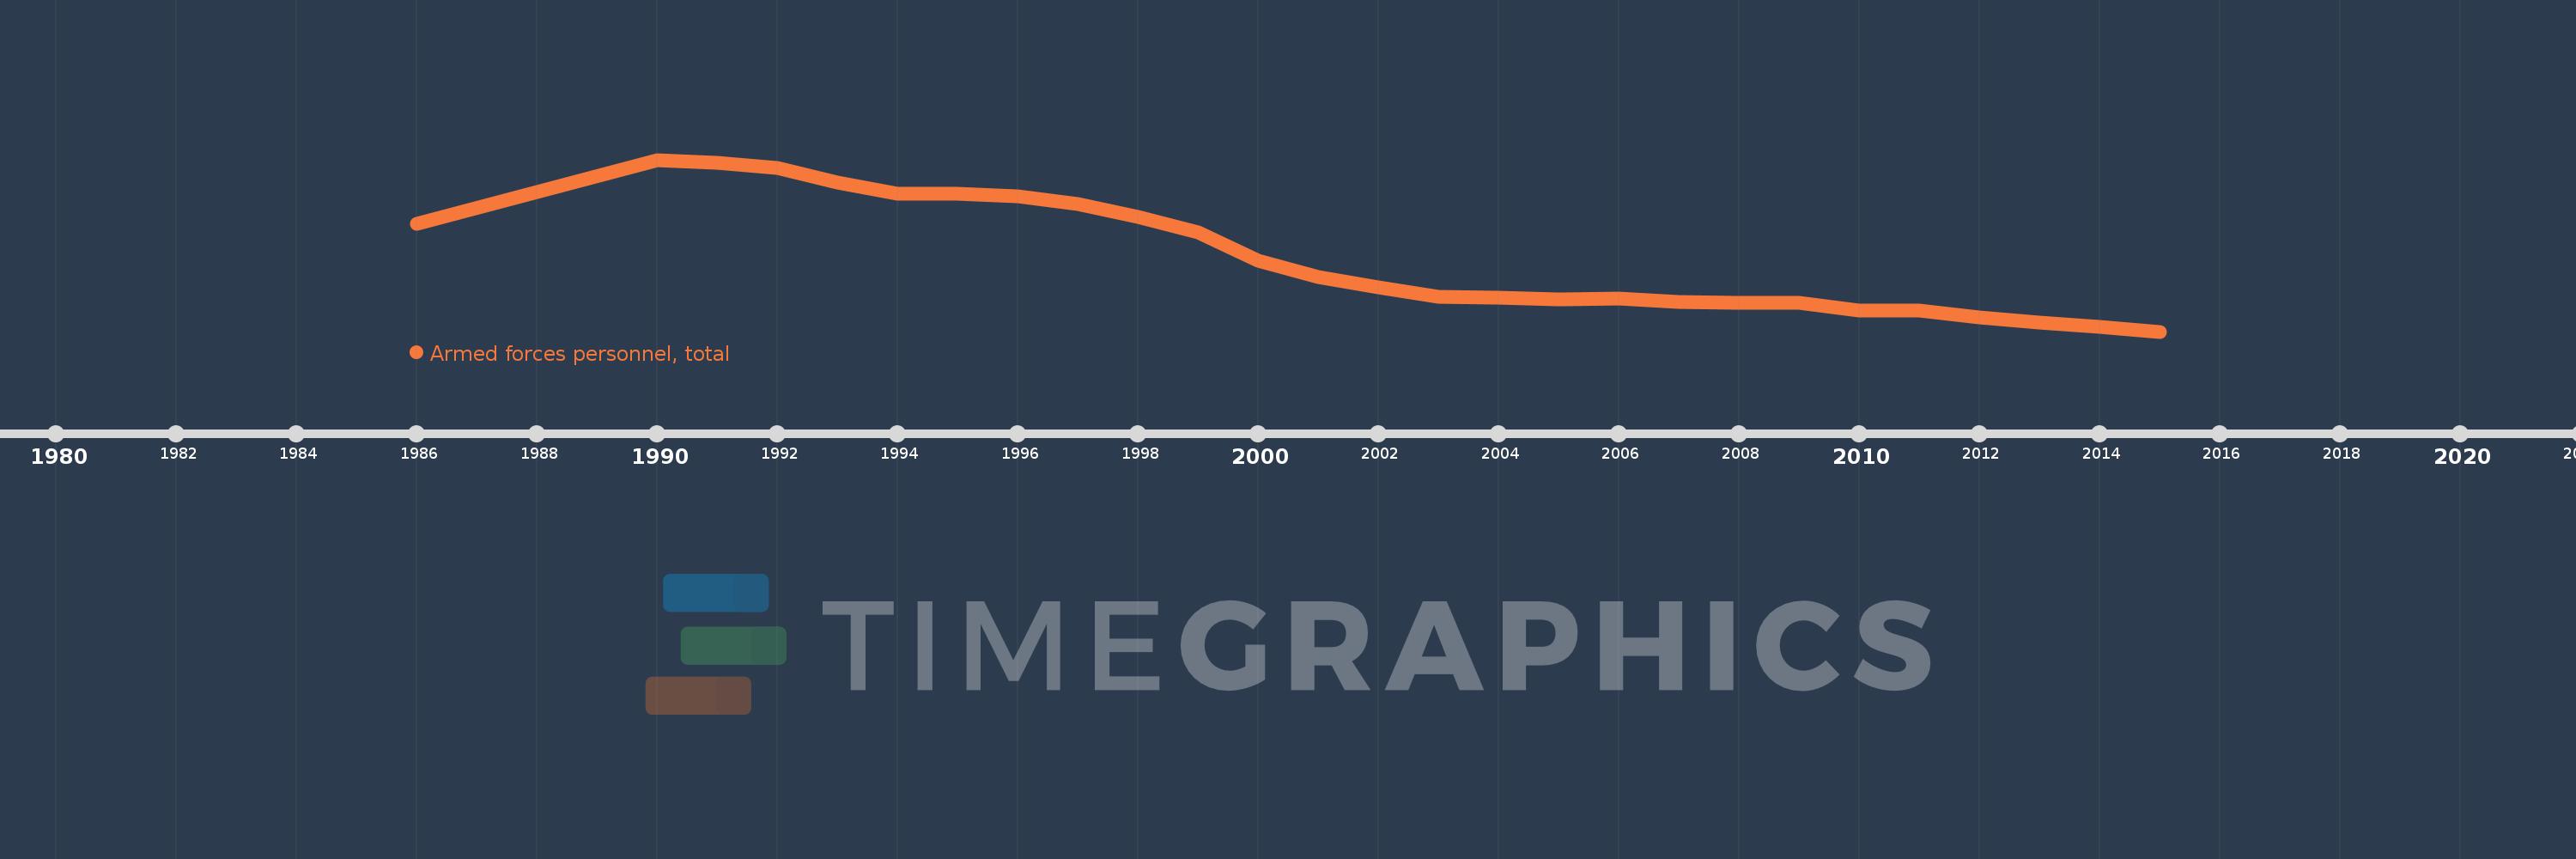
En esta escala de tiempo se presenta un gráfico de 1986 y 2015 de France. Los datos de 1985 están ausentes. El número de observaciones reales por fecha: 27.
Fuente (nombre):
Indicadores del desarrollo mundial
Fuente (organización):
International Institute for Strategic Studies, The Military Balance.
Categorías:
Public Sector
Se ha actualizado:
23 abr 2017 año
Los indicadores de los cambios de valor en los últimos años
En promedio:
415.201 mil
Mínimo:
312.35 mil
1 ene 2015 año
Máximo:
554.0 mil
1 ene 1990 año
A la fecha de observación
Valor
Cambio absoluto
El cambio con respecto al valor anterior
1 ene 1986 año
464.3 mil
+464.3 mil
0.0%
1 ene 1990 año
554.0 mil
+89.7 mil
19.32%
1 ene 1991 año
550.0 mil
-4.0 mil
-0.72%
1 ene 1992 año
542.0 mil
-8.0 mil
-1.45%
1 ene 1993 año
522.0 mil
-20.0 mil
-3.69%
1 ene 1994 año
506.0 mil
-16.0 mil
-3.07%
1 ene 1995 año
506.0 mil
0.0
0.0%
1 ene 1996 año
502.4 mil
-3.6 mil
-0.71%
1 ene 1997 año
491.3 mil
-11.1 mil
-2.21%
1 ene 1998 año
473.1 mil
-18.2 mil
-3.7%
1 ene 1999 año
452.2 mil
-20.9 mil
-4.42%
1 ene 2000 año
411.6 mil
-40.6 mil
-8.98%
1 ene 2001 año
389.4 mil
-22.2 mil
-5.39%
1 ene 2002 año
374.4 mil
-15.0 mil
-3.85%
1 ene 2003 año
361.8 mil
-12.6 mil
-3.37%
1 ene 2004 año
360.4 mil
-1.4 mil
-0.39%
1 ene 2005 año
358.0 mil
-2.4 mil
-0.67%
1 ene 2006 año
359.0 mil
+1000.0
0.28%
1 ene 2007 año
354.0 mil
-5.0 mil
-1.39%
1 ene 2008 año
353.0 mil
-1000.0
-0.28%
1 ene 2009 año
353.0 mil
0.0
0.0%
1 ene 2010 año
341.967 mil
-11.033 mil
-3.13%
1 ene 2011 año
341.967 mil
0.0
0.0%
1 ene 2012 año
332.25 mil
-9.717 mil
-2.84%
1 ene 2013 año
325.6 mil
-6.65 mil
-2.0%
1 ene 2014 año
318.4 mil
-7.2 mil
-2.21%
1 ene 2015 año
312.35 mil
-6.05 mil
-1.9%
Ranking de los países por los datos estadísticos actuales