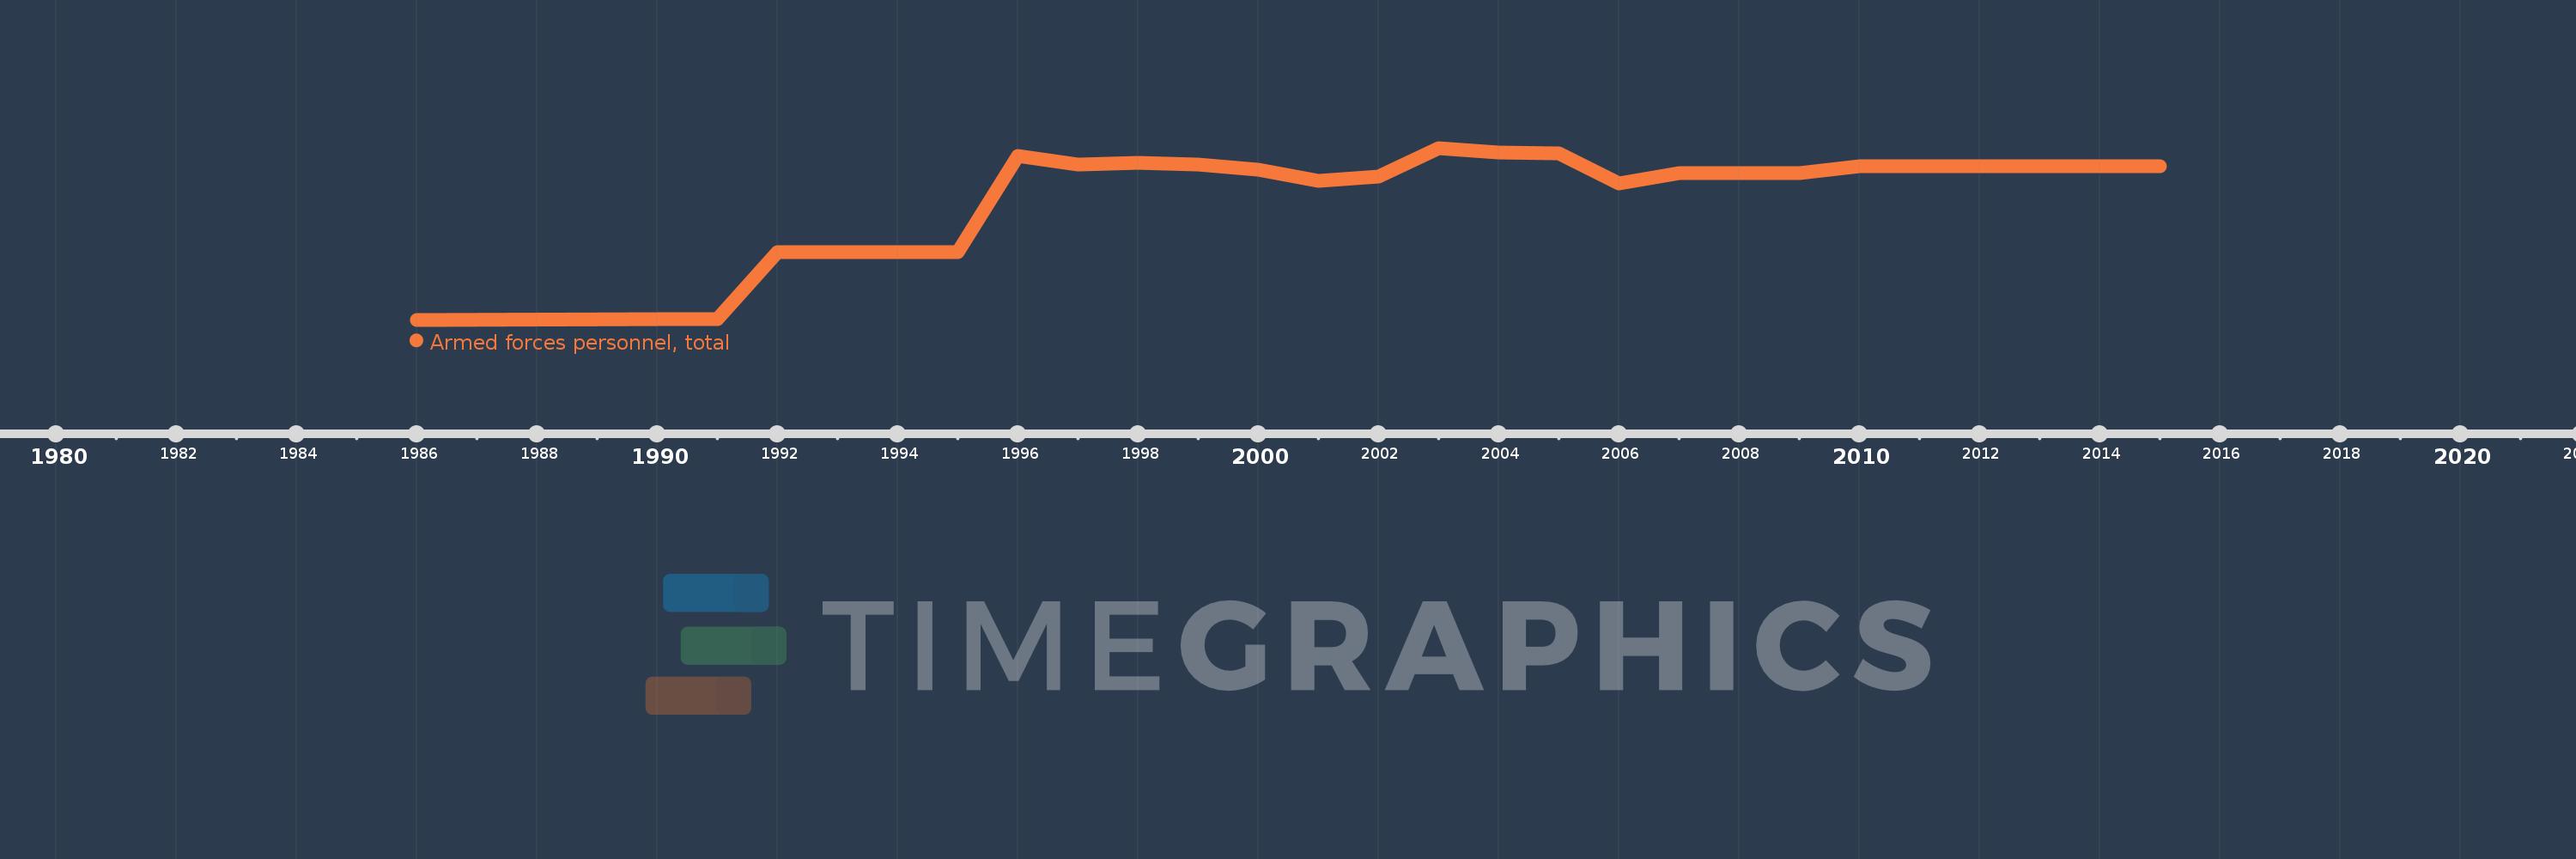
En esta escala de tiempo se presenta un gráfico de 1986 y 2015 de Sri Lanka. Los datos de 1985 están ausentes. El número de observaciones reales por fecha: 27.
Fuente (nombre):
Indicadores del desarrollo mundial
Fuente (organización):
International Institute for Strategic Studies, The Military Balance.
Categorías:
Public Sector
Se ha actualizado:
23 abr 2017 año
Los indicadores de los cambios de valor en los últimos años
En promedio:
183.489 mil
Mínimo:
21.6 mil
1 ene 1986 año
Máximo:
246.5 mil
1 ene 2003 año
A la fecha de observación
Valor
Cambio absoluto
El cambio con respecto al valor anterior
1 ene 1986 año
21.6 mil
+21.6 mil
0.0%
1 ene 1990 año
22.0 mil
+400.0
1.85%
1 ene 1991 año
22.0 mil
0.0
0.0%
1 ene 1992 año
110.0 mil
+88.0 mil
400.0%
1 ene 1993 año
110.0 mil
0.0
0.0%
1 ene 1994 año
110.0 mil
0.0
0.0%
1 ene 1995 año
110.0 mil
0.0
0.0%
1 ene 1996 año
235.5 mil
+125.5 mil
114.09%
1 ene 1997 año
225.2 mil
-10.3 mil
-4.37%
1 ene 1998 año
227.2 mil
+2.0 mil
0.89%
1 ene 1999 año
225.2 mil
-2.0 mil
-0.88%
1 ene 2000 año
218.3 mil
-6.9 mil
-3.06%
1 ene 2001 año
203.6 mil
-14.7 mil
-6.73%
1 ene 2002 año
209.6 mil
+6.0 mil
2.95%
1 ene 2003 año
246.5 mil
+36.9 mil
17.6%
1 ene 2004 año
240.9 mil
-5.6 mil
-2.27%
1 ene 2005 año
239.0 mil
-1.9 mil
-0.79%
1 ene 2006 año
200.0 mil
-39.0 mil
-16.32%
1 ene 2007 año
213.0 mil
+13.0 mil
6.5%
1 ene 2008 año
213.0 mil
0.0
0.0%
1 ene 2009 año
213.0 mil
0.0
0.0%
1 ene 2010 año
223.1 mil
+10.1 mil
4.74%
1 ene 2011 año
223.1 mil
0.0
0.0%
1 ene 2012 año
223.1 mil
0.0
0.0%
1 ene 2013 año
223.1 mil
0.0
0.0%
1 ene 2014 año
223.1 mil
0.0
0.0%
1 ene 2015 año
223.1 mil
0.0
0.0%
Ranking de los países por los datos estadísticos actuales