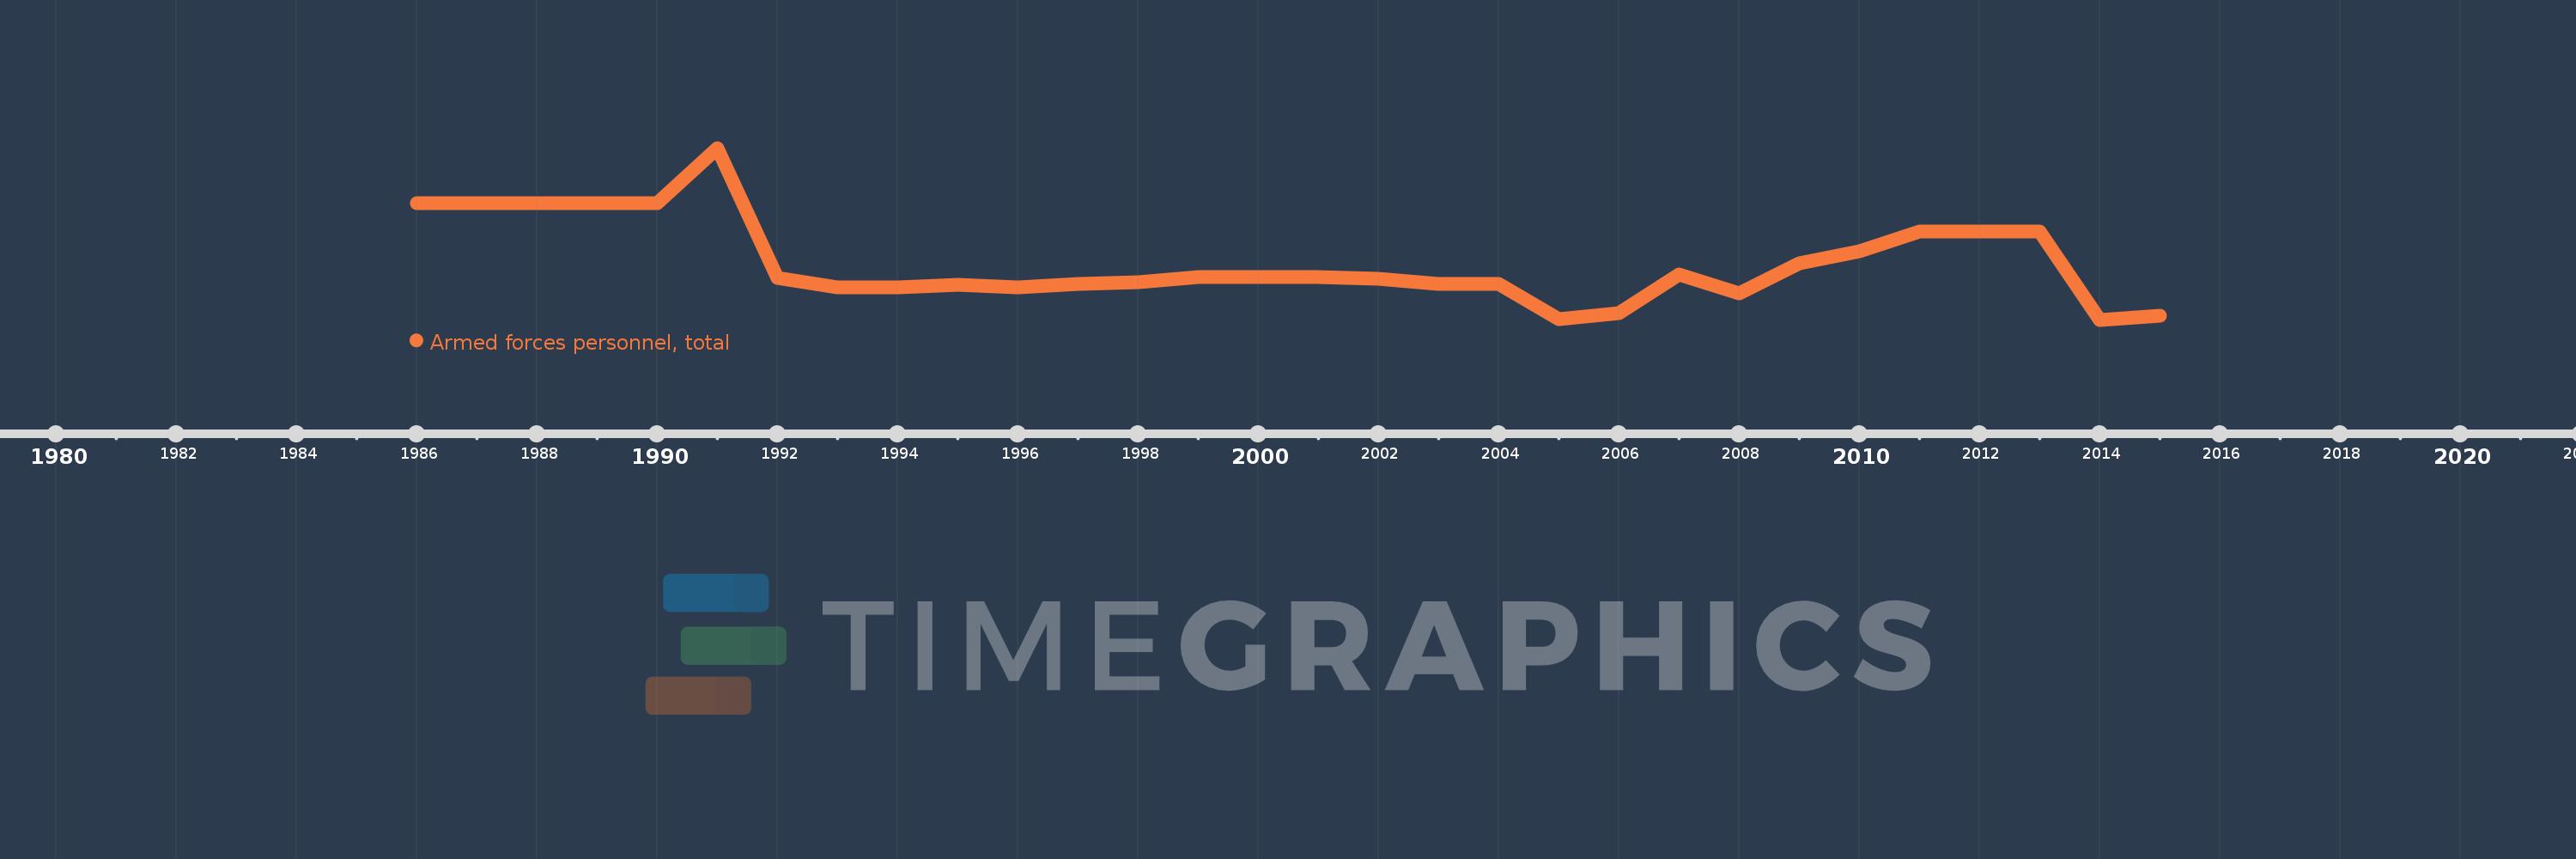
En esta escala de tiempo se presenta un gráfico de 1986 y 2015 de Iraq. Los datos de 1985 están ausentes. El número de observaciones reales por fecha: 27.
Fuente (nombre):
Indicadores del desarrollo mundial
Fuente (organización):
International Institute for Strategic Studies, The Military Balance.
Categorías:
Public Sector
Se ha actualizado:
23 abr 2017 año
Los indicadores de los cambios de valor en los últimos años
En promedio:
535.107 mil
Mínimo:
177.6 mil
1 ene 2014 año
Máximo:
1.39 millones
1 ene 1991 año
A la fecha de observación
Valor
Cambio absoluto
El cambio con respecto al valor anterior
1 ene 1986 año
1000.0 mil
+1000.0 mil
0.0%
1 ene 1990 año
1000.0 mil
0.0
0.0%
1 ene 1991 año
1.39 millones
+390.0 mil
39.0%
1 ene 1992 año
475.0 mil
-915.0 mil
-65.83%
1 ene 1993 año
407.0 mil
-68.0 mil
-14.32%
1 ene 1994 año
407.0 mil
0.0
0.0%
1 ene 1995 año
425.0 mil
+18.0 mil
4.42%
1 ene 1996 año
407.3 mil
-17.7 mil
-4.16%
1 ene 1997 año
432.5 mil
+25.2 mil
6.19%
1 ene 1998 año
442.9 mil
+10.4 mil
2.4%
1 ene 1999 año
479.0 mil
+36.1 mil
8.15%
1 ene 2000 año
479.0 mil
0.0
0.0%
1 ene 2001 año
479.0 mil
0.0
0.0%
1 ene 2002 año
467.0 mil
-12.0 mil
-2.51%
1 ene 2003 año
432.0 mil
-35.0 mil
-7.49%
1 ene 2004 año
432.0 mil
0.0
0.0%
1 ene 2005 año
179.0 mil
-253.0 mil
-58.56%
1 ene 2006 año
227.0 mil
+48.0 mil
26.82%
1 ene 2007 año
495.0 mil
+268.0 mil
118.06%
1 ene 2008 año
362.0 mil
-133.0 mil
-26.87%
1 ene 2009 año
577.0 mil
+215.0 mil
59.39%
1 ene 2010 año
659.395 mil
+82.395 mil
14.28%
1 ene 2011 año
802.4 mil
+143.005 mil
21.69%
1 ene 2012 año
802.4 mil
0.0
0.0%
1 ene 2013 año
802.4 mil
0.0
0.0%
1 ene 2014 año
177.6 mil
-624.8 mil
-77.87%
1 ene 2015 año
209.0 mil
+31.4 mil
17.68%
Ranking de los países por los datos estadísticos actuales