33
/es/
AIzaSyAYiBZKx7MnpbEhh9jyipgxe19OcubqV5w
August 1, 2025
272282
Uganda
UGA
true
2
1
Grants and other revenue (current LCU)
2015,2014,2013,2012,2011,2010,2009,2008,2007,2006,2005,2004,2003,2002,2001,2000,1999
Download
Estadísticas Globales de la Biblioteca →Uganda →

Grants and other revenue (current LCU)

Estas estadísticas en otros países:

AfghanistanAlbaniaAlgeriaAngolaAntigua and BarbudaArgentinaArmeniaAustraliaAustriaAzerbaijanBahamas, TheBahrainBangladeshBarbadosBelarusBelgiumBelizeBeninBhutanBoliviaBosnia and HerzegovinaBotswanaBrazilBulgariaBurkina FasoBurundiCabo VerdeCambodiaCanadaCentral African RepublicChileChinaColombiaCongo, Dem. Rep.Congo, Rep.Costa RicaCote d'IvoireCroatiaCyprusCzech RepublicDenmarkDominicaDominican RepublicEgypt, Arab Rep.El SalvadorEquatorial GuineaEstoniaEthiopiaFijiFinlandFranceGambia, TheGeorgiaGermanyGhanaGreeceGrenadaGuatemalaHondurasHong Kong SAR, ChinaHungaryIcelandIndiaIndonesiaIran, Islamic Rep.IraqIrelandIsraelItalyJamaicaJapanJordanKazakhstanKenyaKiribatiKorea, Rep.KuwaitKyrgyz RepublicLao PDRLatviaLebanonLesothoLiberiaLithuaniaLuxembourgMacao SAR, ChinaMacedonia, FYRMadagascarMalawiMalaysiaMaldivesMaliMaltaMauritiusMexicoMicronesia, Fed. Sts.MoldovaMongoliaMoroccoMozambiqueMyanmarNamibiaNepalNetherlandsNew ZealandNicaraguaNigeriaNorwayOmanPakistanPanamaPapua New GuineaParaguayPeruPhilippinesPolandPortugalQatarRomaniaRussian FederationRwandaSamoaSan MarinoSao Tome and PrincipeSenegalSerbiaSeychellesSierra LeoneSingaporeSlovak RepublicSloveniaSolomon IslandsSouth AfricaSpainSri LankaSt. Kitts and NevisSt. LuciaSt. Vincent and the GrenadinesSurinameSwazilandSwedenSwitzerlandSyrian Arab RepublicTajikistanTanzaniaThailandTimor-LesteTogoTrinidad and TobagoTunisiaTurkeyUgandaUkraineUnited Arab EmiratesUnited KingdomUnited StatesUruguayVanuatuVenezuela, RBVietnamWest Bank and GazaYemen, Rep.ZambiaZimbabwe

línea de tiempo (timeline):

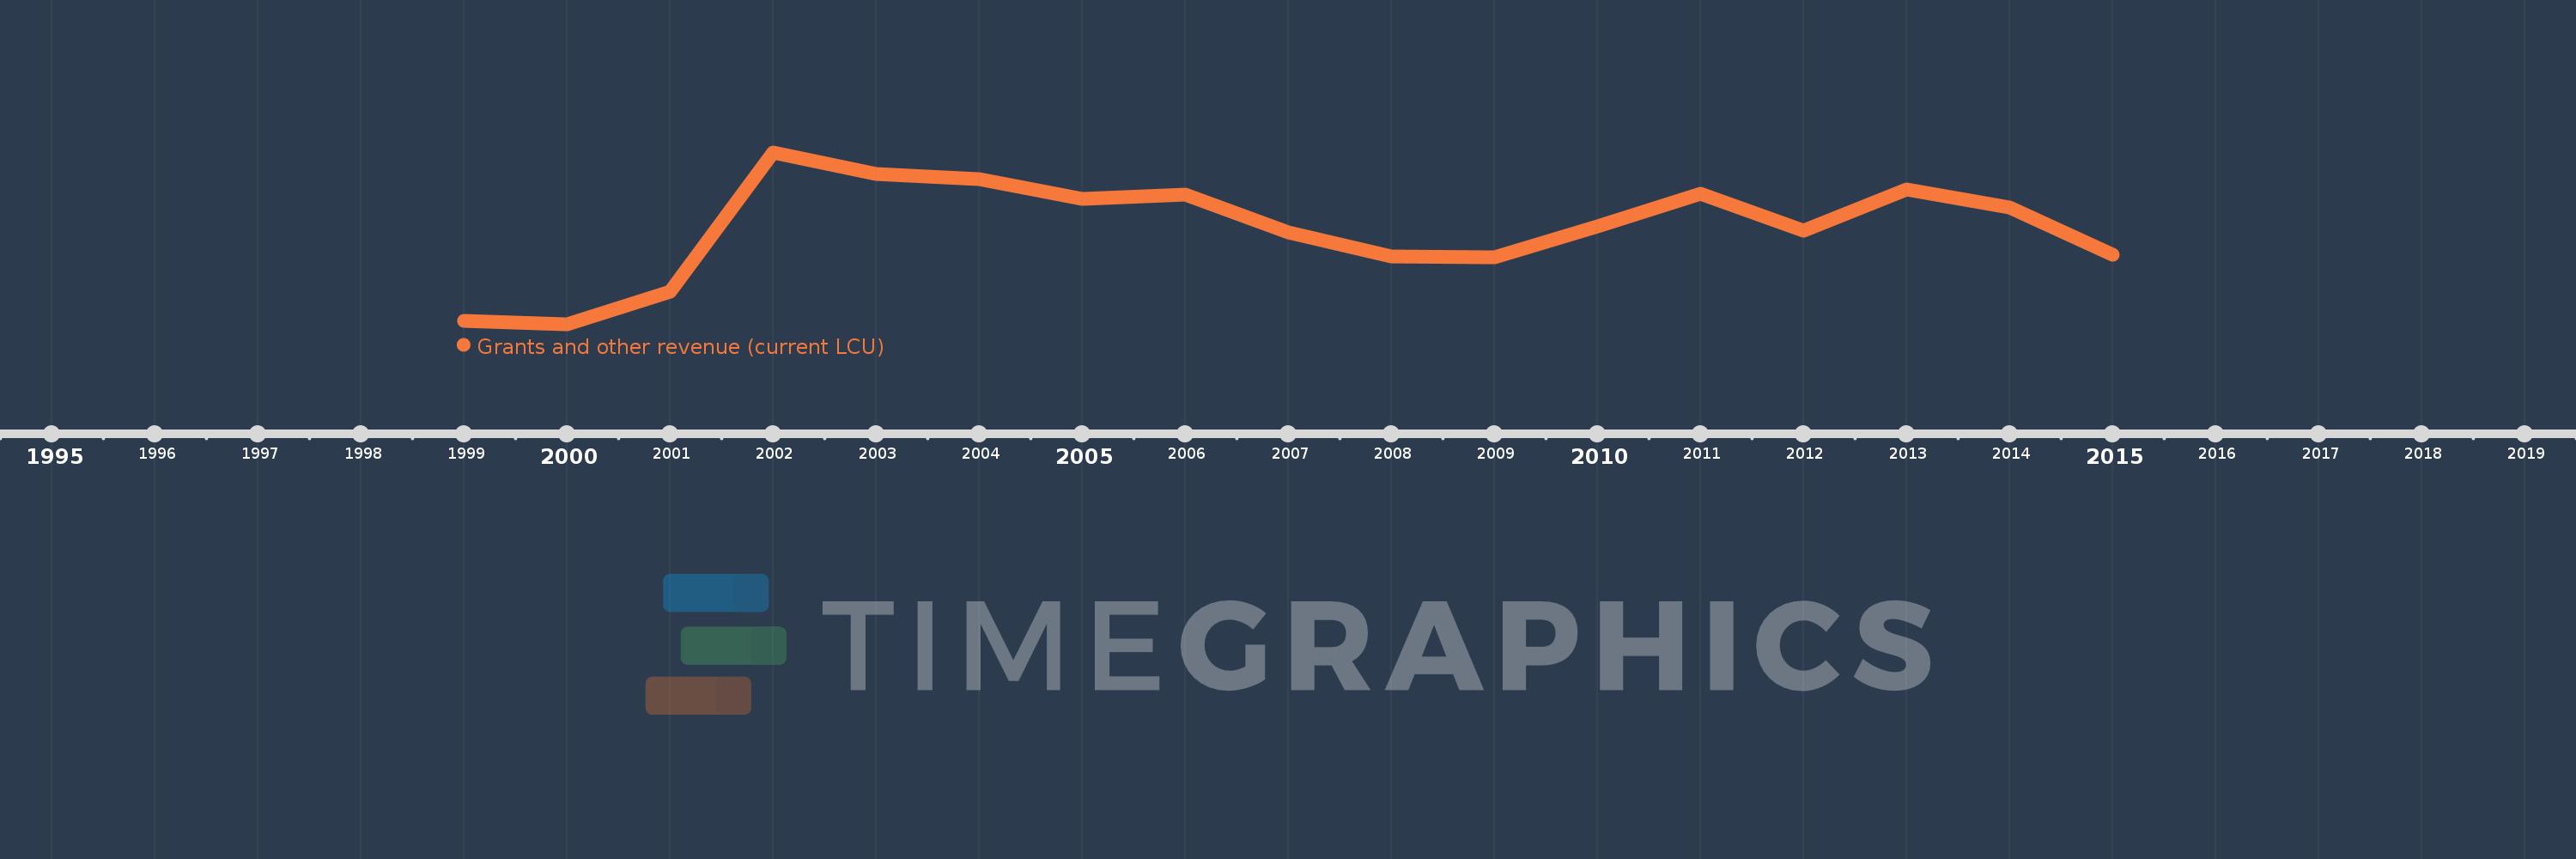
En esta escala de tiempo se presenta un gráfico de 1999 y 2015 de Uganda. Los datos de 1998 están ausentes. El número de observaciones reales por fecha: 17.

Fuente (nombre):

Indicadores del desarrollo mundial

Fuente (organización):

International Monetary Fund, Government Finance Statistics Yearbook and data files.

Categorías:

Public Sector

Se ha actualizado:

23 abr 2017 año

Los indicadores de los cambios de valor en los últimos años

En promedio:
998.621 bn
Mínimo:
422.037 bn
1 ene 2000 año
Máximo:
1.457 billones
1 ene 2002 año
A la fecha de observación
Valor
Cambio absoluto
El cambio con respecto al valor anterior
1 ene 1999 año
444.0 bn
+444.0 bn
0.0%
1 ene 2000 año
422.037 bn
-21.963 bn
-4.95%
1 ene 2001 año
618.298 bn
+196.262 bn
46.5%
1 ene 2002 año
1.457 billones
+838.741 bn
135.65%
1 ene 2003 año
1.328 billones
-129.139 bn
-8.86%
1 ene 2004 año
1.294 billones
-34.122 bn
-2.57%
1 ene 2005 año
1.175 billones
-119.153 bn
-9.21%
1 ene 2006 año
1.204 billones
+29.277 bn
2.49%
1 ene 2007 año
977.6 bn
-226.302 bn
-18.8%
1 ene 2008 año
829.765 bn
-147.835 bn
-15.12%
1 ene 2009 año
824.209 bn
-5.556 bn
-0.67%
1 ene 2010 año
1.009 billones
+184.893 bn
22.43%
1 ene 2011 año
1.207 billones
+198.05 bn
19.63%
1 ene 2012 año
985.564 bn
-221.587 bn
-18.36%
1 ene 2013 año
1.235 billones
+249.6 bn
25.33%
1 ene 2014 año
1.127 billones
-108.124 bn
-8.75%
1 ene 2015 año
839.38 bn
-287.66 bn
-25.52%

Ranking de los países por los datos estadísticos actuales