33
/es/
AIzaSyAYiBZKx7MnpbEhh9jyipgxe19OcubqV5w
August 1, 2025
206791
Nepal
NPL
true
2
1
Grants and other revenue (current LCU)
2016,2015,2014,2013,2012,2011,2010,2009,2008,2007,2006,2005,2004,2003,2002,2001,2000,1999,1998,1997,1996,1995,1994,1993,1992,1991
Download
Estadísticas Globales de la Biblioteca →Nepal →

Grants and other revenue (current LCU)

Estas estadísticas en otros países:

AfghanistanAlbaniaAlgeriaAngolaAntigua and BarbudaArgentinaArmeniaAustraliaAustriaAzerbaijanBahamas, TheBahrainBangladeshBarbadosBelarusBelgiumBelizeBeninBhutanBoliviaBosnia and HerzegovinaBotswanaBrazilBulgariaBurkina FasoBurundiCabo VerdeCambodiaCanadaCentral African RepublicChileChinaColombiaCongo, Dem. Rep.Congo, Rep.Costa RicaCote d'IvoireCroatiaCyprusCzech RepublicDenmarkDominicaDominican RepublicEgypt, Arab Rep.El SalvadorEquatorial GuineaEstoniaEthiopiaFijiFinlandFranceGambia, TheGeorgiaGermanyGhanaGreeceGrenadaGuatemalaHondurasHong Kong SAR, ChinaHungaryIcelandIndiaIndonesiaIran, Islamic Rep.IraqIrelandIsraelItalyJamaicaJapanJordanKazakhstanKenyaKiribatiKorea, Rep.KuwaitKyrgyz RepublicLao PDRLatviaLebanonLesothoLiberiaLithuaniaLuxembourgMacao SAR, ChinaMacedonia, FYRMadagascarMalawiMalaysiaMaldivesMaliMaltaMauritiusMexicoMicronesia, Fed. Sts.MoldovaMongoliaMoroccoMozambiqueMyanmarNamibiaNepalNetherlandsNew ZealandNicaraguaNigeriaNorwayOmanPakistanPanamaPapua New GuineaParaguayPeruPhilippinesPolandPortugalQatarRomaniaRussian FederationRwandaSamoaSan MarinoSao Tome and PrincipeSenegalSerbiaSeychellesSierra LeoneSingaporeSlovak RepublicSloveniaSolomon IslandsSouth AfricaSpainSri LankaSt. Kitts and NevisSt. LuciaSt. Vincent and the GrenadinesSurinameSwazilandSwedenSwitzerlandSyrian Arab RepublicTajikistanTanzaniaThailandTimor-LesteTogoTrinidad and TobagoTunisiaTurkeyUgandaUkraineUnited Arab EmiratesUnited KingdomUnited StatesUruguayVanuatuVenezuela, RBVietnamWest Bank and GazaYemen, Rep.ZambiaZimbabwe

línea de tiempo (timeline):

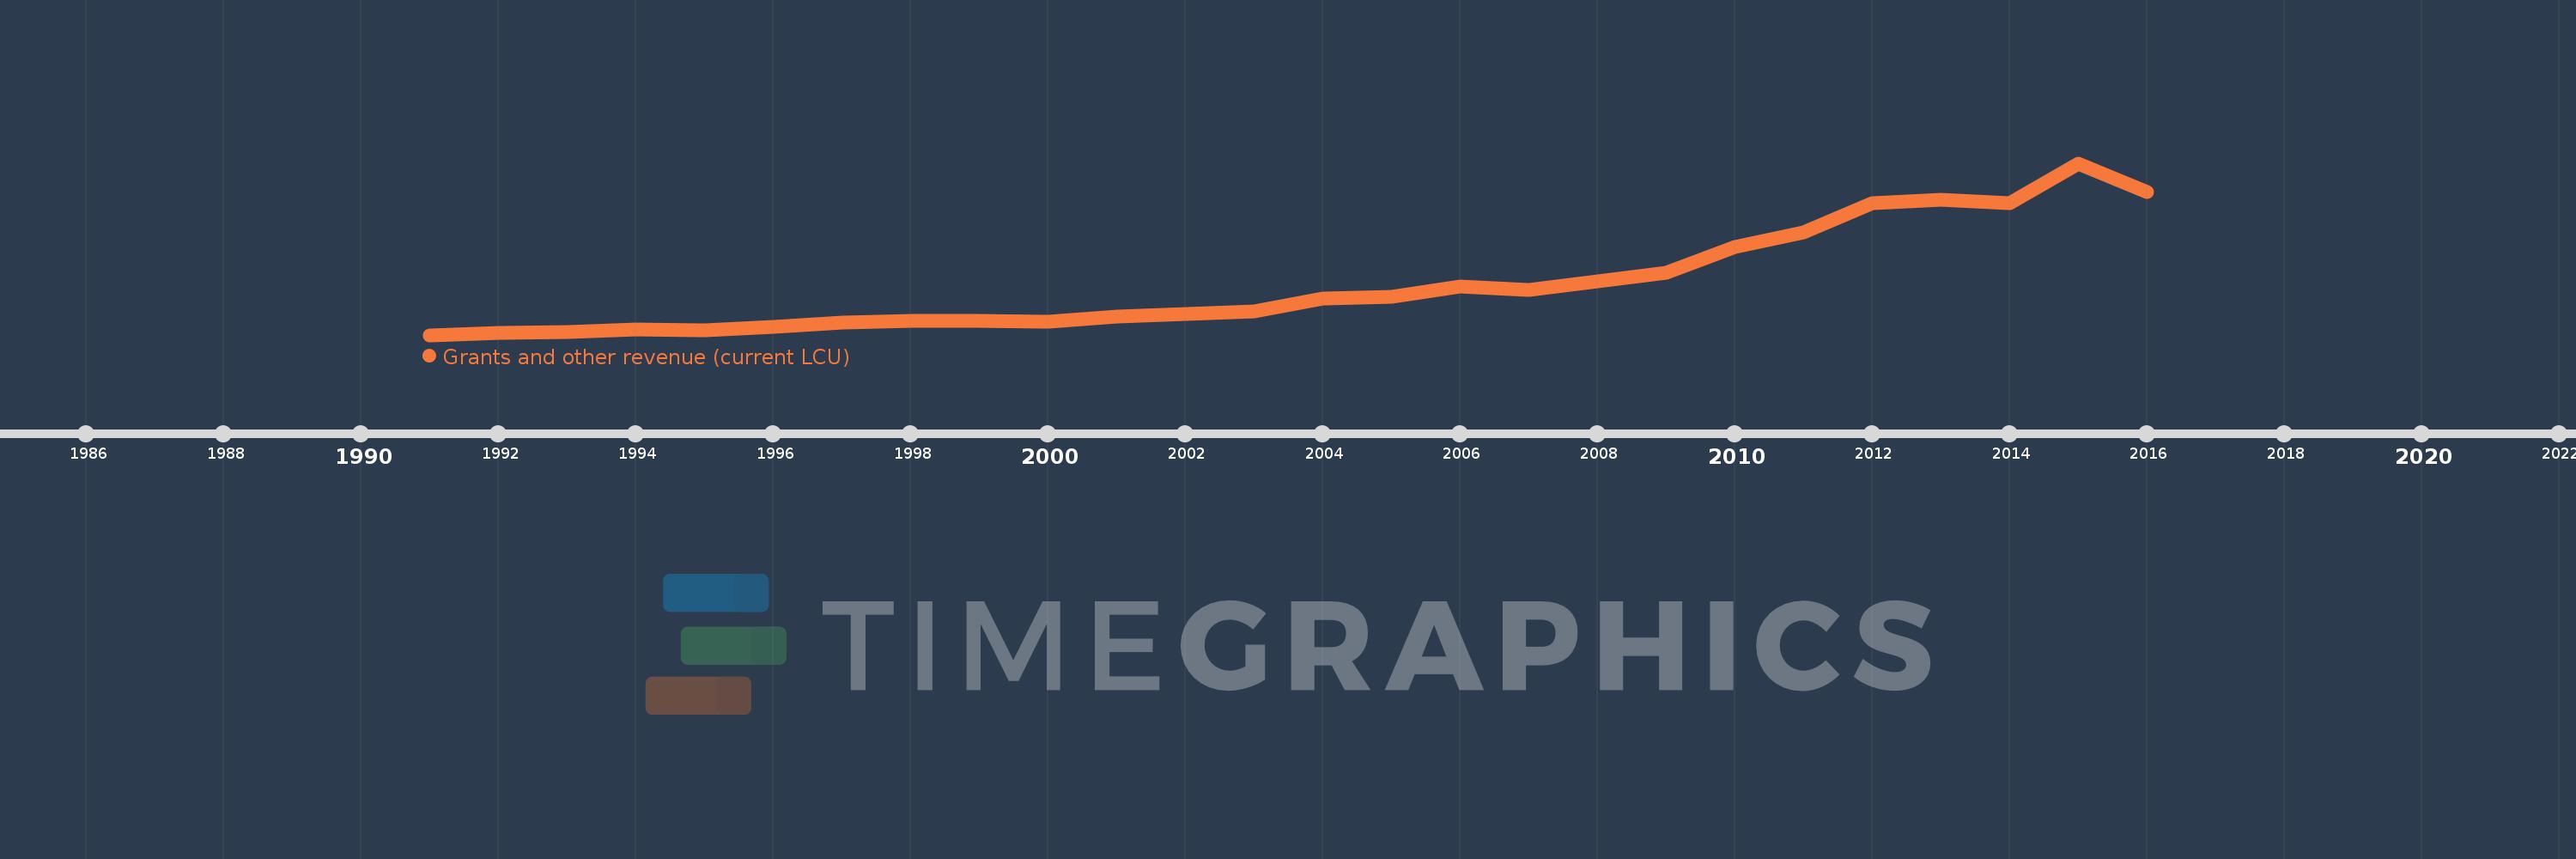
En esta escala de tiempo se presenta un gráfico de 1991 y 2016 de Nepal. Los datos de 1990 están ausentes. El número de observaciones reales por fecha: 26.

Fuente (nombre):

Indicadores del desarrollo mundial

Fuente (organización):

International Monetary Fund, Government Finance Statistics Yearbook and data files.

Categorías:

Public Sector

Se ha actualizado:

23 abr 2017 año

Los indicadores de los cambios de valor en los últimos años

En promedio:
29.794 bn
Mínimo:
3.327 bn
1 ene 1991 año
Máximo:
92.191 bn
1 ene 2015 año
A la fecha de observación
Valor
Cambio absoluto
El cambio con respecto al valor anterior
1 ene 1991 año
3.327 bn
+3.327 bn
0.0%
1 ene 1992 año
4.379 bn
+1.053 bn
31.64%
1 ene 1993 año
4.74 bn
+360.6 millones
8.23%
1 ene 1994 año
6.405 bn
+1.665 bn
35.13%
1 ene 1995 año
5.821 bn
-584.0 millones
-9.12%
1 ene 1996 año
7.349 bn
+1.528 bn
26.25%
1 ene 1997 año
9.721 bn
+2.372 bn
32.28%
1 ene 1998 año
10.81 bn
+1.089 bn
11.2%
1 ene 1999 año
10.783 bn
-27.0 millones
-0.25%
1 ene 2000 año
10.242 bn
-541.0 millones
-5.02%
1 ene 2001 año
12.863 bn
+2.621 bn
25.59%
1 ene 2002 año
14.034 bn
+1.171 bn
9.1%
1 ene 2003 año
15.61 bn
+1.576 bn
11.23%
1 ene 2004 año
22.431 bn
+6.821 bn
43.7%
1 ene 2005 año
22.891 bn
+460.0 millones
2.05%
1 ene 2006 año
28.351 bn
+5.46 bn
23.85%
1 ene 2007 año
26.673 bn
-1.678 bn
-5.92%
1 ene 2008 año
31.061 bn
+4.388 bn
16.45%
1 ene 2009 año
35.494 bn
+4.433 bn
14.27%
1 ene 2010 año
48.973 bn
+13.479 bn
37.97%
1 ene 2011 año
56.464 bn
+7.491 bn
15.3%
1 ene 2012 año
71.656 bn
+15.191 bn
26.9%
1 ene 2013 año
73.343 bn
+1.687 bn
2.35%
1 ene 2014 año
71.701 bn
-1.642 bn
-2.24%
1 ene 2015 año
92.191 bn
+20.49 bn
28.58%
1 ene 2016 año
77.337 bn
-14.854 bn
-16.11%

Ranking de los países por los datos estadísticos actuales