33
/es/
AIzaSyAYiBZKx7MnpbEhh9jyipgxe19OcubqV5w
August 1, 2025
167534
Kenya
KEN
true
2
1
Grants and other revenue (current LCU)
2014,2013,2012,2011,2010,2009,2008,2007,2006,2005,2004,2003,2002,2001,2000,1999,1998,1997,1996,1995,1994,1993,1992
Download
Estadísticas Globales de la Biblioteca →Kenya →

Grants and other revenue (current LCU)

Estas estadísticas en otros países:

AfghanistanAlbaniaAlgeriaAngolaAntigua and BarbudaArgentinaArmeniaAustraliaAustriaAzerbaijanBahamas, TheBahrainBangladeshBarbadosBelarusBelgiumBelizeBeninBhutanBoliviaBosnia and HerzegovinaBotswanaBrazilBulgariaBurkina FasoBurundiCabo VerdeCambodiaCanadaCentral African RepublicChileChinaColombiaCongo, Dem. Rep.Congo, Rep.Costa RicaCote d'IvoireCroatiaCyprusCzech RepublicDenmarkDominicaDominican RepublicEgypt, Arab Rep.El SalvadorEquatorial GuineaEstoniaEthiopiaFijiFinlandFranceGambia, TheGeorgiaGermanyGhanaGreeceGrenadaGuatemalaHondurasHong Kong SAR, ChinaHungaryIcelandIndiaIndonesiaIran, Islamic Rep.IraqIrelandIsraelItalyJamaicaJapanJordanKazakhstanKenyaKiribatiKorea, Rep.KuwaitKyrgyz RepublicLao PDRLatviaLebanonLesothoLiberiaLithuaniaLuxembourgMacao SAR, ChinaMacedonia, FYRMadagascarMalawiMalaysiaMaldivesMaliMaltaMauritiusMexicoMicronesia, Fed. Sts.MoldovaMongoliaMoroccoMozambiqueMyanmarNamibiaNepalNetherlandsNew ZealandNicaraguaNigeriaNorwayOmanPakistanPanamaPapua New GuineaParaguayPeruPhilippinesPolandPortugalQatarRomaniaRussian FederationRwandaSamoaSan MarinoSao Tome and PrincipeSenegalSerbiaSeychellesSierra LeoneSingaporeSlovak RepublicSloveniaSolomon IslandsSouth AfricaSpainSri LankaSt. Kitts and NevisSt. LuciaSt. Vincent and the GrenadinesSurinameSwazilandSwedenSwitzerlandSyrian Arab RepublicTajikistanTanzaniaThailandTimor-LesteTogoTrinidad and TobagoTunisiaTurkeyUgandaUkraineUnited Arab EmiratesUnited KingdomUnited StatesUruguayVanuatuVenezuela, RBVietnamWest Bank and GazaYemen, Rep.ZambiaZimbabwe

línea de tiempo (timeline):

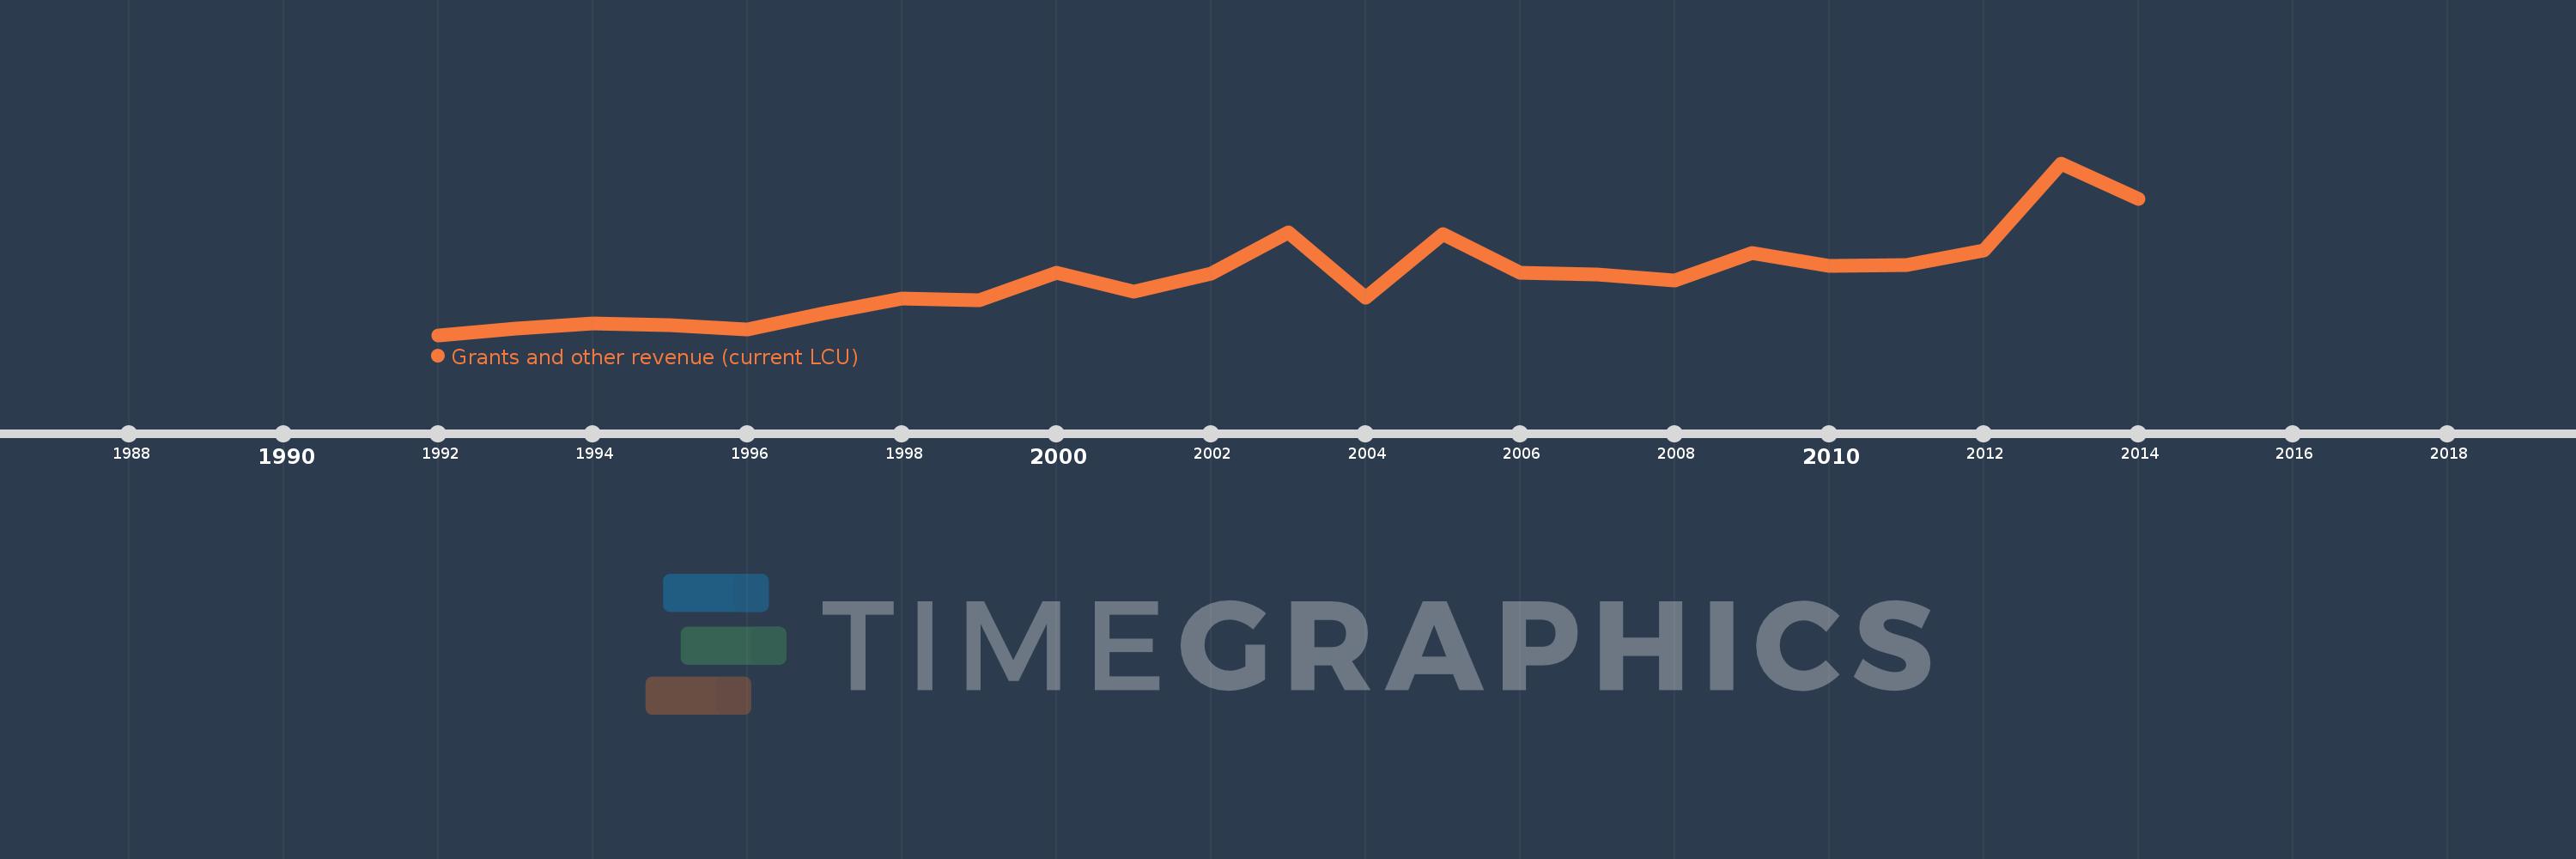
En esta escala de tiempo se presenta un gráfico de 1992 y 2014 de Kenya. Los datos de 1991 están ausentes. El número de observaciones reales por fecha: 23.

Fuente (nombre):

Indicadores del desarrollo mundial

Fuente (organización):

International Monetary Fund, Government Finance Statistics Yearbook and data files.

Categorías:

Public Sector

Se ha actualizado:

23 abr 2017 año

Los indicadores de los cambios de valor en los últimos años

En promedio:
34.455 bn
Mínimo:
7.987 bn
1 ene 1992 año
Máximo:
86.852 bn
1 ene 2013 año
A la fecha de observación
Valor
Cambio absoluto
El cambio con respecto al valor anterior
1 ene 1992 año
7.987 bn
+7.987 bn
0.0%
1 ene 1993 año
10.959 bn
+2.972 bn
37.21%
1 ene 1994 año
13.286 bn
+2.327 bn
21.23%
1 ene 1995 año
12.67 bn
-616.0 millones
-4.64%
1 ene 1996 año
10.701 bn
-1.969 bn
-15.54%
1 ene 1997 año
17.991 bn
+7.29 bn
68.12%
1 ene 1998 año
24.64 bn
+6.649 bn
36.96%
1 ene 1999 año
23.977 bn
-663.4 millones
-2.69%
1 ene 2000 año
36.658 bn
+12.681 bn
52.89%
1 ene 2001 año
27.964 bn
-8.694 bn
-23.72%
1 ene 2002 año
36.069 bn
+8.105 bn
28.98%
1 ene 2003 año
54.949 bn
+18.88 bn
52.34%
1 ene 2004 año
25.11 bn
-29.839 bn
-54.3%
1 ene 2005 año
54.392 bn
+29.281 bn
116.61%
1 ene 2006 año
36.419 bn
-17.973 bn
-33.04%
1 ene 2007 año
35.915 bn
-503.891 millones
-1.38%
1 ene 2008 año
32.842 bn
-3.073 bn
-8.56%
1 ene 2009 año
45.794 bn
+12.952 bn
39.44%
1 ene 2010 año
39.772 bn
-6.022 bn
-13.15%
1 ene 2011 año
40.291 bn
+518.368 millones
1.3%
1 ene 2012 año
46.815 bn
+6.525 bn
16.19%
1 ene 2013 año
86.852 bn
+40.036 bn
85.52%
1 ene 2014 año
70.404 bn
-16.447 bn
-18.94%

Ranking de los países por los datos estadísticos actuales