33
/es/
AIzaSyAYiBZKx7MnpbEhh9jyipgxe19OcubqV5w
August 1, 2025
118951
Denmark
DNK
true
2
1
Grants and other revenue (current LCU)
1995,1994,1993,1992,1991,1990,1989,1988,1987,1986,1985,1984,1983,1982,1981,1980,1979,1978,1977,1976,1975,1974,1973
Download
Estadísticas Globales de la Biblioteca →Denmark →

Grants and other revenue (current LCU)

Estas estadísticas en otros países:

AfghanistanAlbaniaAlgeriaAngolaAntigua and BarbudaArgentinaArmeniaAustraliaAustriaAzerbaijanBahamas, TheBahrainBangladeshBarbadosBelarusBelgiumBelizeBeninBhutanBoliviaBosnia and HerzegovinaBotswanaBrazilBulgariaBurkina FasoBurundiCabo VerdeCambodiaCanadaCentral African RepublicChileChinaColombiaCongo, Dem. Rep.Congo, Rep.Costa RicaCote d'IvoireCroatiaCyprusCzech RepublicDenmarkDominicaDominican RepublicEgypt, Arab Rep.El SalvadorEquatorial GuineaEstoniaEthiopiaFijiFinlandFranceGambia, TheGeorgiaGermanyGhanaGreeceGrenadaGuatemalaHondurasHong Kong SAR, ChinaHungaryIcelandIndiaIndonesiaIran, Islamic Rep.IraqIrelandIsraelItalyJamaicaJapanJordanKazakhstanKenyaKiribatiKorea, Rep.KuwaitKyrgyz RepublicLao PDRLatviaLebanonLesothoLiberiaLithuaniaLuxembourgMacao SAR, ChinaMacedonia, FYRMadagascarMalawiMalaysiaMaldivesMaliMaltaMauritiusMexicoMicronesia, Fed. Sts.MoldovaMongoliaMoroccoMozambiqueMyanmarNamibiaNepalNetherlandsNew ZealandNicaraguaNigeriaNorwayOmanPakistanPanamaPapua New GuineaParaguayPeruPhilippinesPolandPortugalQatarRomaniaRussian FederationRwandaSamoaSan MarinoSao Tome and PrincipeSenegalSerbiaSeychellesSierra LeoneSingaporeSlovak RepublicSloveniaSolomon IslandsSouth AfricaSpainSri LankaSt. Kitts and NevisSt. LuciaSt. Vincent and the GrenadinesSurinameSwazilandSwedenSwitzerlandSyrian Arab RepublicTajikistanTanzaniaThailandTimor-LesteTogoTrinidad and TobagoTunisiaTurkeyUgandaUkraineUnited Arab EmiratesUnited KingdomUnited StatesUruguayVanuatuVenezuela, RBVietnamWest Bank and GazaYemen, Rep.ZambiaZimbabwe

línea de tiempo (timeline):

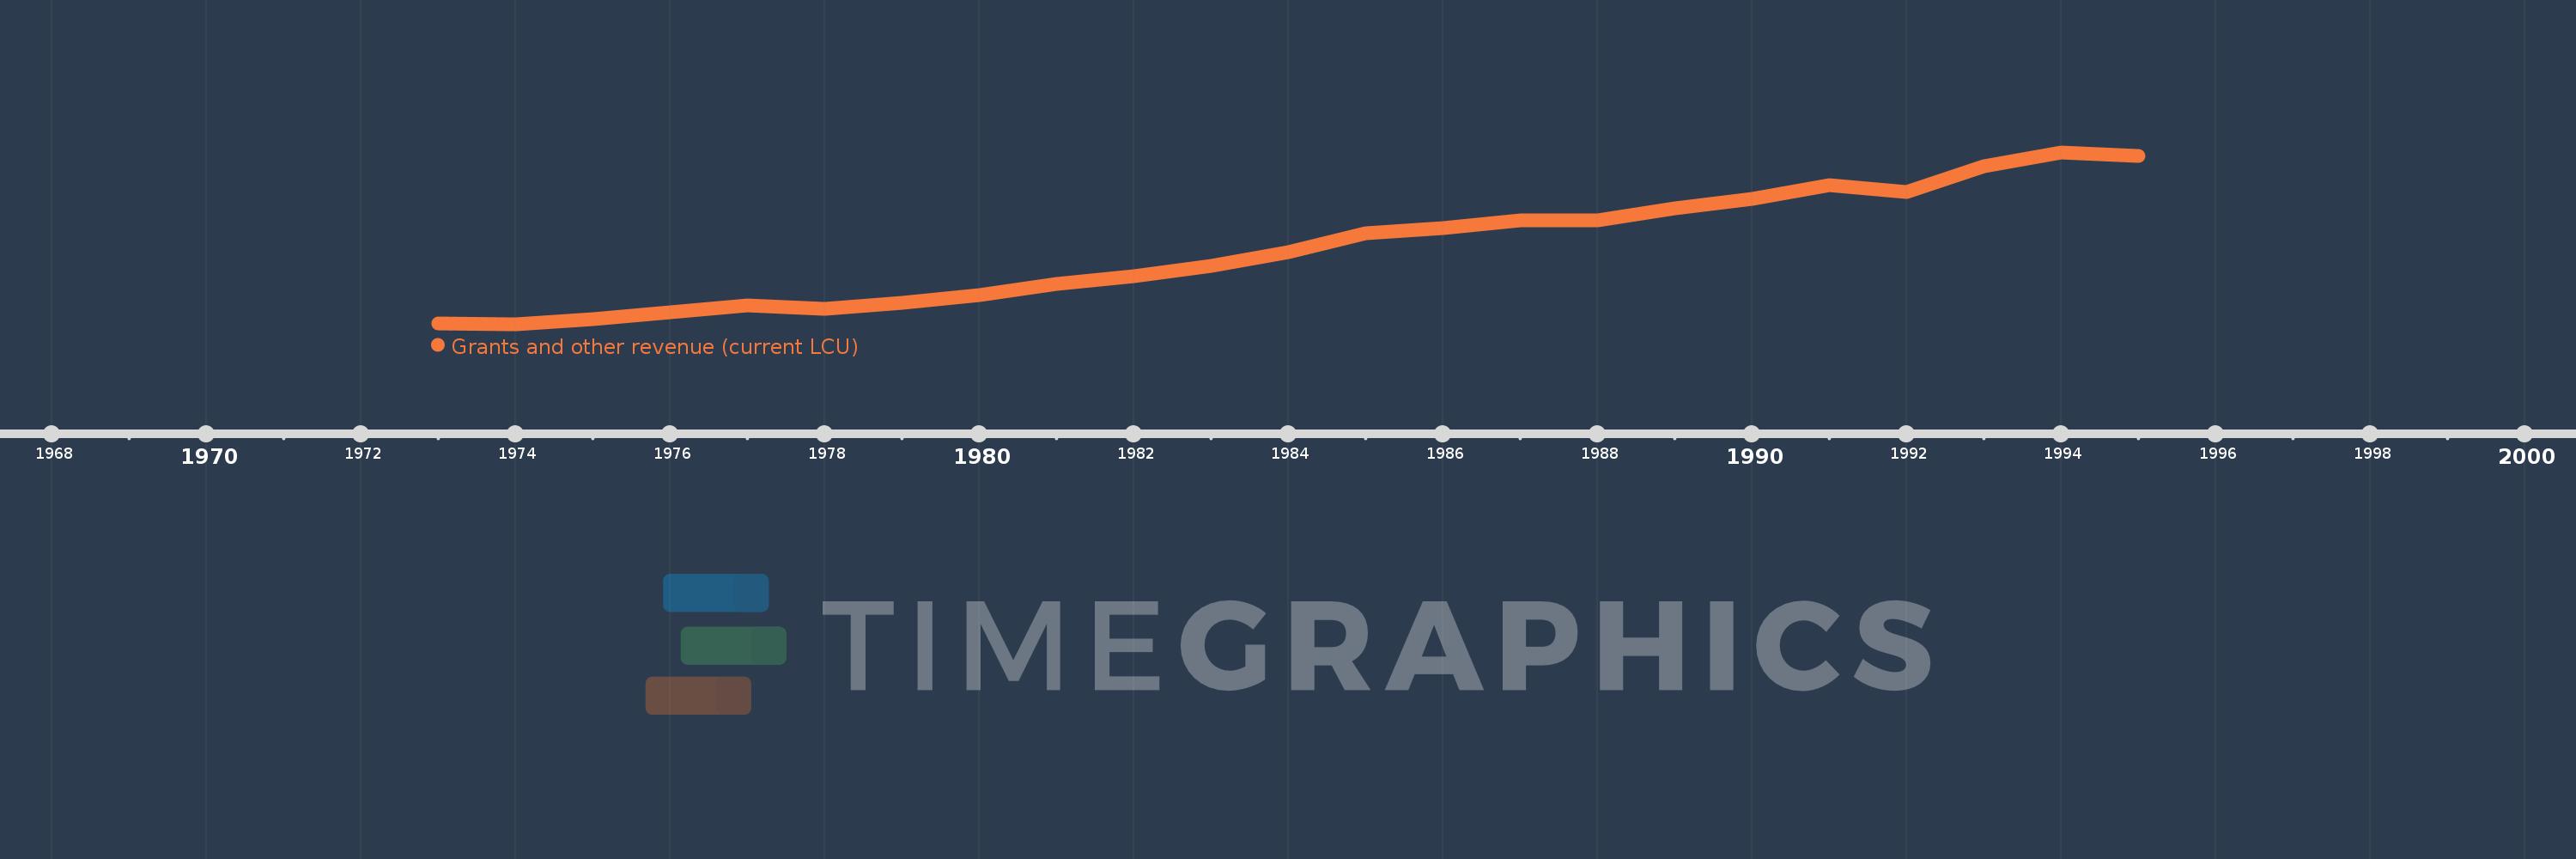
En esta escala de tiempo se presenta un gráfico de 1973 y 1995 de Denmark. Los datos de 1972 están ausentes. El número de observaciones reales por fecha: 23.

Fuente (nombre):

Indicadores del desarrollo mundial

Fuente (organización):

International Monetary Fund, Government Finance Statistics Yearbook and data files.

Categorías:

Public Sector

Se ha actualizado:

23 abr 2017 año

Los indicadores de los cambios de valor en los últimos años

En promedio:
29.842 bn
Mínimo:
3.885 bn
1 ene 1974 año
Máximo:
63.302 bn
1 ene 1994 año
A la fecha de observación
Valor
Cambio absoluto
El cambio con respecto al valor anterior
1 ene 1973 año
4.019 bn
+4.019 bn
0.0%
1 ene 1974 año
3.885 bn
-134.0 millones
-3.33%
1 ene 1975 año
5.561 bn
+1.676 bn
43.14%
1 ene 1976 año
7.874 bn
+2.313 bn
41.59%
1 ene 1977 año
10.414 bn
+2.54 bn
32.26%
1 ene 1978 año
9.185 bn
-1.229 bn
-11.8%
1 ene 1979 año
11.351 bn
+2.166 bn
23.58%
1 ene 1980 año
13.864 bn
+2.513 bn
22.14%
1 ene 1981 año
17.862 bn
+3.998 bn
28.84%
1 ene 1982 año
20.518 bn
+2.656 bn
14.87%
1 ene 1983 año
23.961 bn
+3.443 bn
16.78%
1 ene 1984 año
28.781 bn
+4.82 bn
20.12%
1 ene 1985 año
35.289 bn
+6.508 bn
22.61%
1 ene 1986 año
37.222 bn
+1.933 bn
5.48%
1 ene 1987 año
39.694 bn
+2.472 bn
6.64%
1 ene 1988 año
39.847 bn
+153.0 millones
0.39%
1 ene 1989 año
44.097 bn
+4.25 bn
10.67%
1 ene 1990 año
47.331 bn
+3.234 bn
7.33%
1 ene 1991 año
52.012 bn
+4.681 bn
9.89%
1 ene 1992 año
49.729 bn
-2.283 bn
-4.39%
1 ene 1993 año
58.529 bn
+8.8 bn
17.7%
1 ene 1994 año
63.302 bn
+4.773 bn
8.15%
1 ene 1995 año
62.044 bn
-1.258 bn
-1.99%

Ranking de los países por los datos estadísticos actuales