33
/es/
AIzaSyB4mHJ5NPEv-XzF7P6NDYXjlkCWaeKw5bc
November 30, 2025
110977
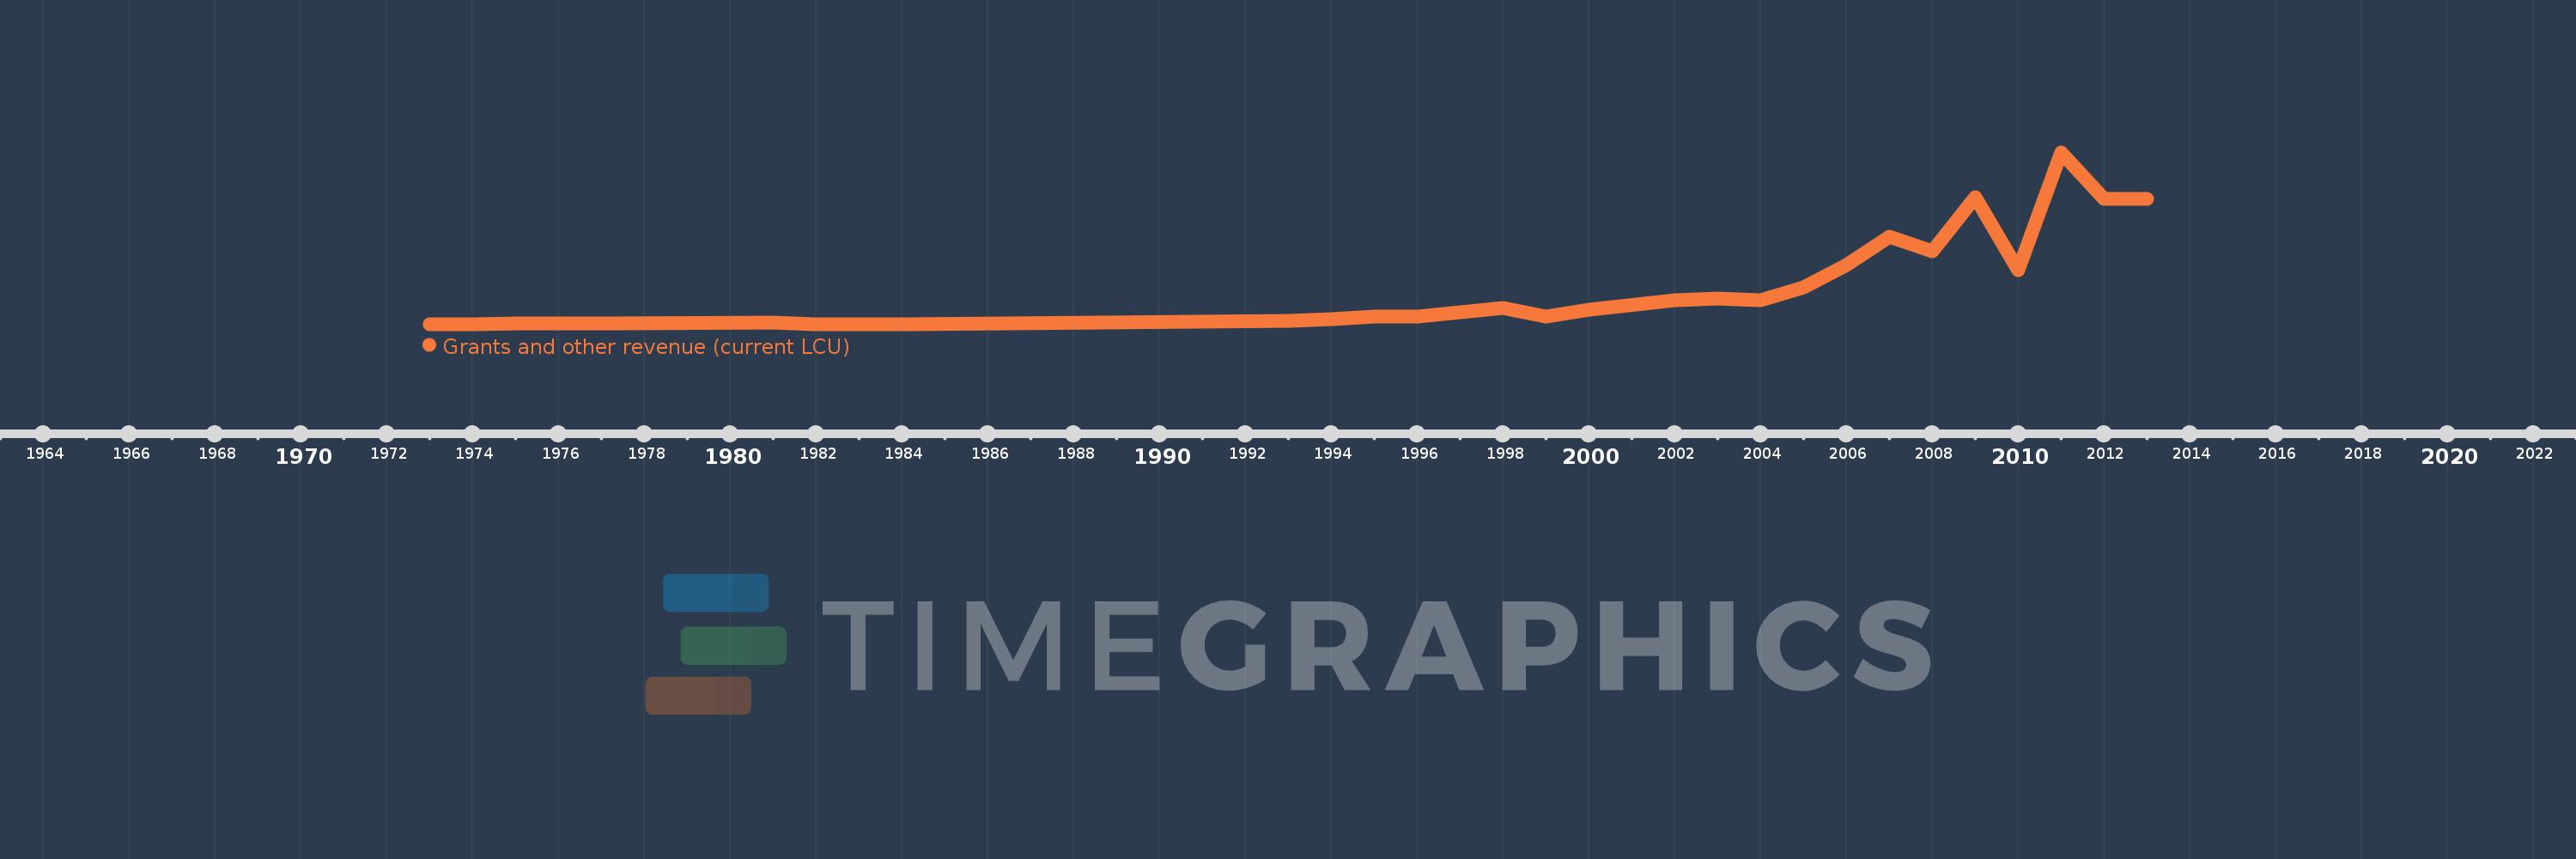
Congo, Rep.
COG
true
2
1
Grants and other revenue (current LCU)
2013,2012,2011,2010,2009,2008,2007,2006,2005,2004,2003,2002,2000,1999,1998,1997,1996,1995,1994,1993,1984,1983,1982,1981,1977,1976,1975,1974,1973