33
/es/
AIzaSyAYiBZKx7MnpbEhh9jyipgxe19OcubqV5w
August 1, 2025
270089
Turkey
TUR
true
2
1
Stocks traded, total value (% of GDP)
2016,2015,2014,2013,2012,2011,2010,2009,2008,2007,2006,2005,2004,2003,2002,2001,2000,1999,1998,1997,1996,1995,1994,1993,1992
Download
Estadísticas Globales de la Biblioteca →Turkey →

Stocks traded, total value (% of GDP)

Estas estadísticas en otros países:

Arab WorldArgentinaArmeniaAustraliaAustriaBahrainBangladeshBarbadosBelgiumBermudaBoliviaBotswanaBrazilBulgariaCanadaCayman IslandsCentral Europe and the BalticsChannel IslandsChileChinaColombiaCosta RicaCote d'IvoireCroatiaCyprusCzech RepublicDenmarkEarly-demographic dividendEast Asia & PacificEast Asia & Pacific (excluding high income)East Asia & Pacific (IDA & IBRD countries)EcuadorEgypt, Arab Rep.El SalvadorEstoniaEuro areaEurope & Central AsiaEurope & Central Asia (excluding high income)Europe & Central Asia (IDA & IBRD countries)European UnionFijiFinlandFranceGeorgiaGermanyGhanaGreeceGuyanaHigh incomeHong Kong SAR, ChinaHungaryIBRD onlyIcelandIDA & IBRD totalIDA blendIDA totalIndiaIndonesiaIran, Islamic Rep.IrelandIsraelItalyJamaicaJapanJordanKazakhstanKenyaKorea, Rep.KuwaitKyrgyz RepublicLate-demographic dividendLatin America & Caribbean Latin America & Caribbean (excluding high income)Latin America & the Caribbean (IDA & IBRD countries)LatviaLebanonLithuaniaLow & middle incomeLower middle incomeLuxembourgMacedonia, FYRMalawiMalaysiaMaltaMauritiusMexicoMiddle East & North AfricaMiddle East & North Africa (excluding high income)Middle East & North Africa (IDA & IBRD countries)Middle incomeMoldovaMongoliaMontenegroMoroccoNamibiaNetherlandsNew ZealandNigeriaNorth AmericaNorwayOECD membersOmanOther small statesPakistanPanamaPapua New GuineaParaguayPeruPhilippinesPolandPortugalPost-demographic dividendQatarRomaniaRussian FederationSaudi ArabiaSerbiaSeychellesSingaporeSlovak RepublicSloveniaSouth AfricaSouth AsiaSouth Asia (IDA & IBRD)SpainSri LankaSt. Kitts and NevisSub-Saharan Africa Sub-Saharan Africa (excluding high income)Sub-Saharan Africa (IDA & IBRD countries)SwazilandSwedenSwitzerlandTanzaniaThailandTrinidad and TobagoTunisiaTurkeyUgandaUkraineUnited Arab EmiratesUnited KingdomUnited StatesUpper middle incomeUruguayUzbekistanVenezuela, RBVietnamWest Bank and GazaWorldZambiaZimbabwe

línea de tiempo (timeline):

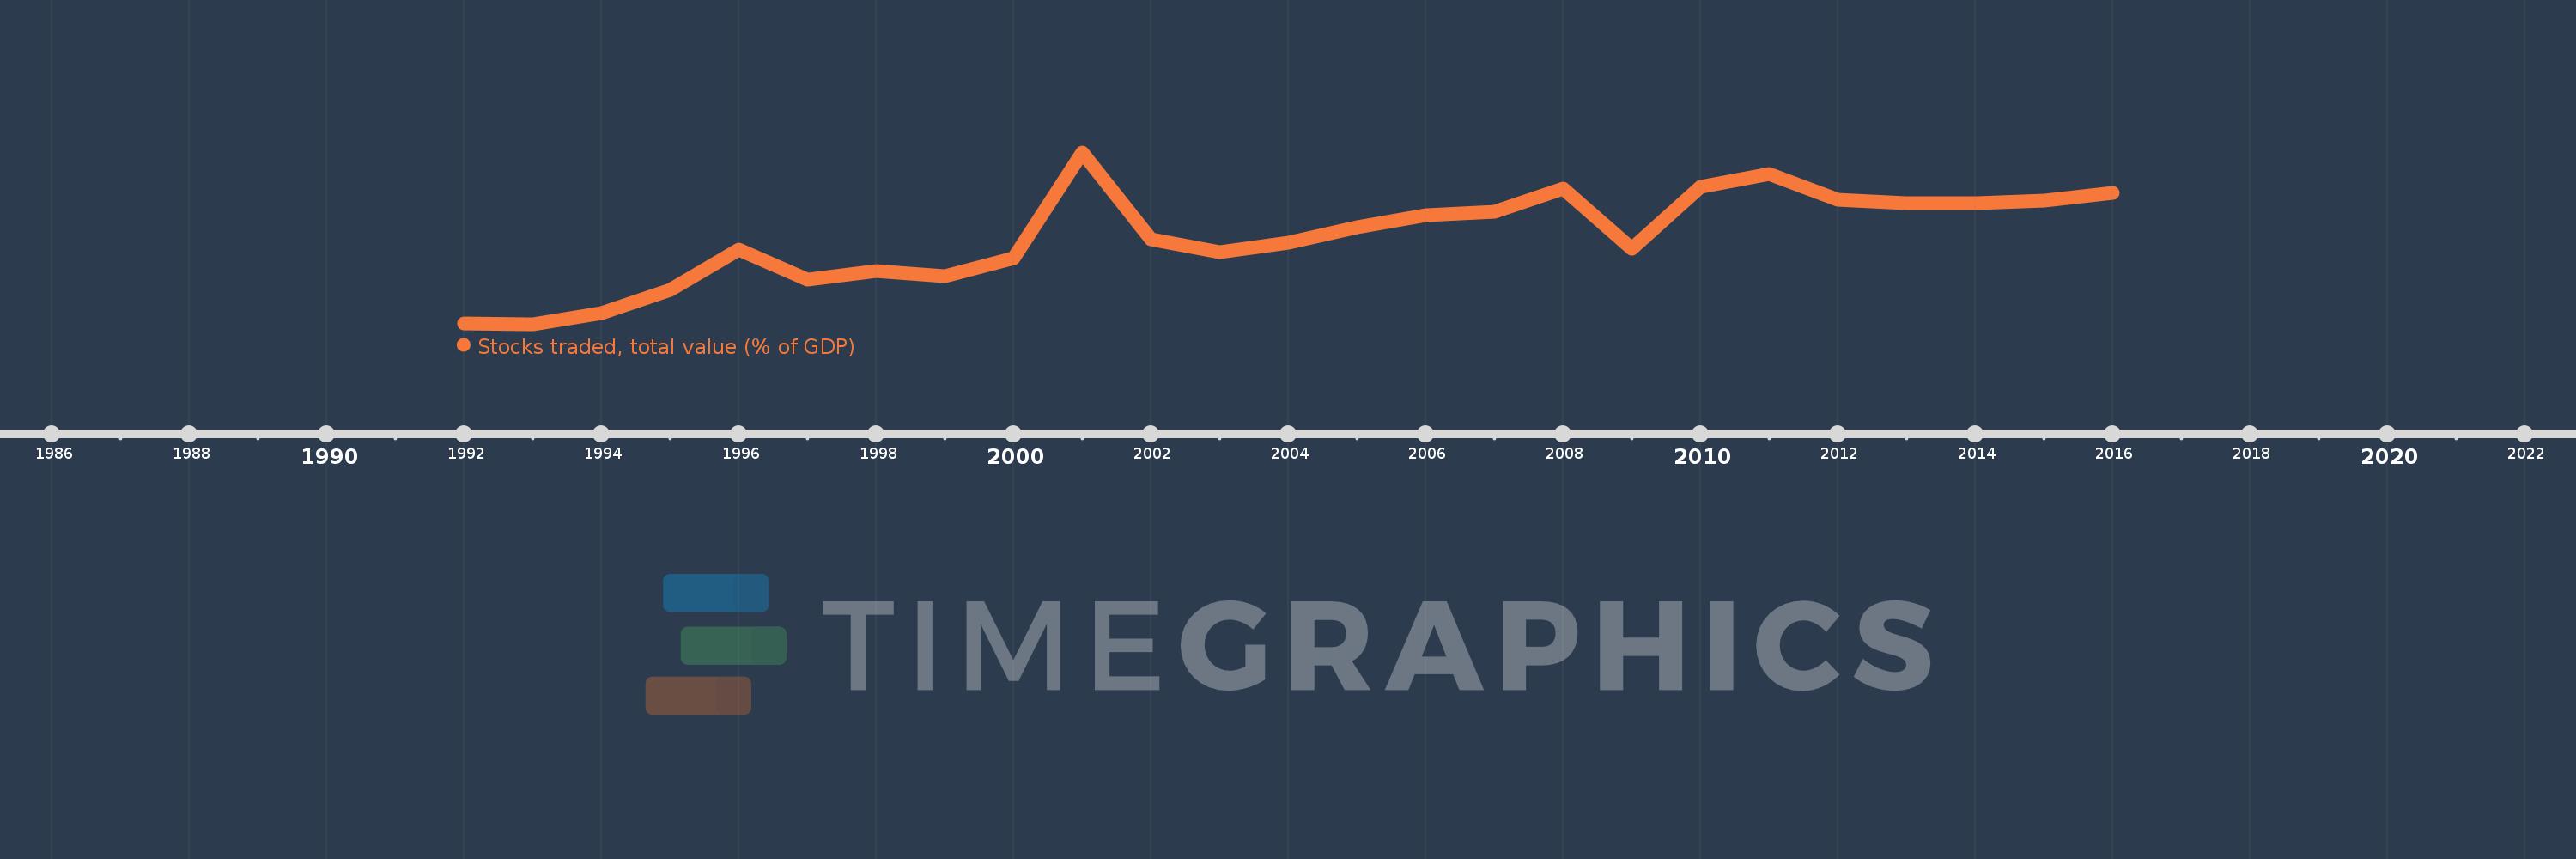
En esta escala de tiempo se presenta un gráfico de 1992 y 2016 de Turkey. Los datos de 1991 están ausentes. El número de observaciones reales por fecha: 25.

Fuente (nombre):

Indicadores del desarrollo mundial

Fuente (organización):

World Federation of Exchanges database.

Categorías:

Financial Sector

Se ha actualizado:

23 abr 2017 año

Los indicadores de los cambios de valor en los últimos años

En promedio:
34.222
Mínimo:
5.267
1 ene 1993 año
Máximo:
62.261
1 ene 2001 año
A la fecha de observación
Valor
Cambio absoluto
El cambio con respecto al valor anterior
1 ene 1992 año
5.517
+5.517
0.0%
1 ene 1993 año
5.267
-0.25
-4.53%
1 ene 1994 año
8.88
+3.613
68.59%
1 ene 1995 año
16.579
+7.699
86.7%
1 ene 1996 año
30.025
+13.446
81.11%
1 ene 1997 año
19.966
-10.06
-33.5%
1 ene 1998 año
23.013
+3.048
15.26%
1 ene 1999 año
21.23
-1.783
-7.75%
1 ene 2000 año
27.223
+5.992
28.23%
1 ene 2001 año
62.261
+35.038
128.71%
1 ene 2002 año
33.509
-28.752
-46.18%
1 ene 2003 año
29.231
-4.279
-12.77%
1 ene 2004 año
32.385
+3.154
10.79%
1 ene 2005 año
37.372
+4.987
15.4%
1 ene 2006 año
41.353
+3.981
10.65%
1 ene 2007 año
42.658
+1.305
3.15%
1 ene 2008 año
50.19
+7.533
17.66%
1 ene 2009 año
30.293
-19.898
-39.64%
1 ene 2010 año
50.884
+20.592
67.98%
1 ene 2011 año
55.153
+4.269
8.39%
1 ene 2012 año
46.604
-8.549
-15.5%
1 ene 2013 año
45.499
-1.105
-2.37%
1 ene 2014 año
45.46
-0.039
-0.09%
1 ene 2015 año
46.289
+0.829
1.82%
1 ene 2016 año
48.711
+2.422
5.23%

Ranking de los países por los datos estadísticos actuales