29
/es/
es
AIzaSyAYiBZKx7MnpbEhh9jyipgxe19OcubqV5w
April 1, 2024
159918
Ireland
IRL
true
2
1
Stocks traded, total value (% of GDP)
2016,2015,2014,2013,2012,2011,2010,2009,2008,2007,2006,2005,2004,2003,2002,2001,2000,1999,1998,1997,1996
Download
Estadísticas Globales de la Biblioteca →Ireland →

Stocks traded, total value (% of GDP)

Estas estadísticas en otros países:
Arab WorldArgentinaArmeniaAustraliaAustriaBahrainBangladeshBarbadosBelgiumBermudaBoliviaBotswanaBrazilBulgariaCanadaCayman IslandsCentral Europe and the BalticsChannel IslandsChileChinaColombiaCosta RicaCote d'IvoireCroatiaCyprusCzech RepublicDenmarkEarly-demographic dividendEast Asia & PacificEast Asia & Pacific (excluding high income)East Asia & Pacific (IDA & IBRD countries)EcuadorEgypt, Arab Rep.El SalvadorEstoniaEuro areaEurope & Central AsiaEurope & Central Asia (excluding high income)Europe & Central Asia (IDA & IBRD countries)European UnionFijiFinlandFranceGeorgiaGermanyGhanaGreeceGuyanaHigh incomeHong Kong SAR, ChinaHungaryIBRD onlyIcelandIDA & IBRD totalIDA blendIDA totalIndiaIndonesiaIran, Islamic Rep.IrelandIsraelItalyJamaicaJapanJordanKazakhstanKenyaKorea, Rep.KuwaitKyrgyz RepublicLate-demographic dividendLatin America & Caribbean Latin America & Caribbean (excluding high income)Latin America & the Caribbean (IDA & IBRD countries)LatviaLebanonLithuaniaLow & middle incomeLower middle incomeLuxembourgMacedonia, FYRMalawiMalaysiaMaltaMauritiusMexicoMiddle East & North AfricaMiddle East & North Africa (excluding high income)Middle East & North Africa (IDA & IBRD countries)Middle incomeMoldovaMongoliaMontenegroMoroccoNamibiaNetherlandsNew ZealandNigeriaNorth AmericaNorwayOECD membersOmanOther small statesPakistanPanamaPapua New GuineaParaguayPeruPhilippinesPolandPortugalPost-demographic dividendQatarRomaniaRussian FederationSaudi ArabiaSerbiaSeychellesSingaporeSlovak RepublicSloveniaSouth AfricaSouth AsiaSouth Asia (IDA & IBRD)SpainSri LankaSt. Kitts and NevisSub-Saharan Africa Sub-Saharan Africa (excluding high income)Sub-Saharan Africa (IDA & IBRD countries)SwazilandSwedenSwitzerlandTanzaniaThailandTrinidad and TobagoTunisiaTurkeyUgandaUkraineUnited Arab EmiratesUnited KingdomUnited StatesUpper middle incomeUruguayUzbekistanVenezuela, RBVietnamWest Bank and GazaWorldZambiaZimbabwe
línea de tiempo (timeline):
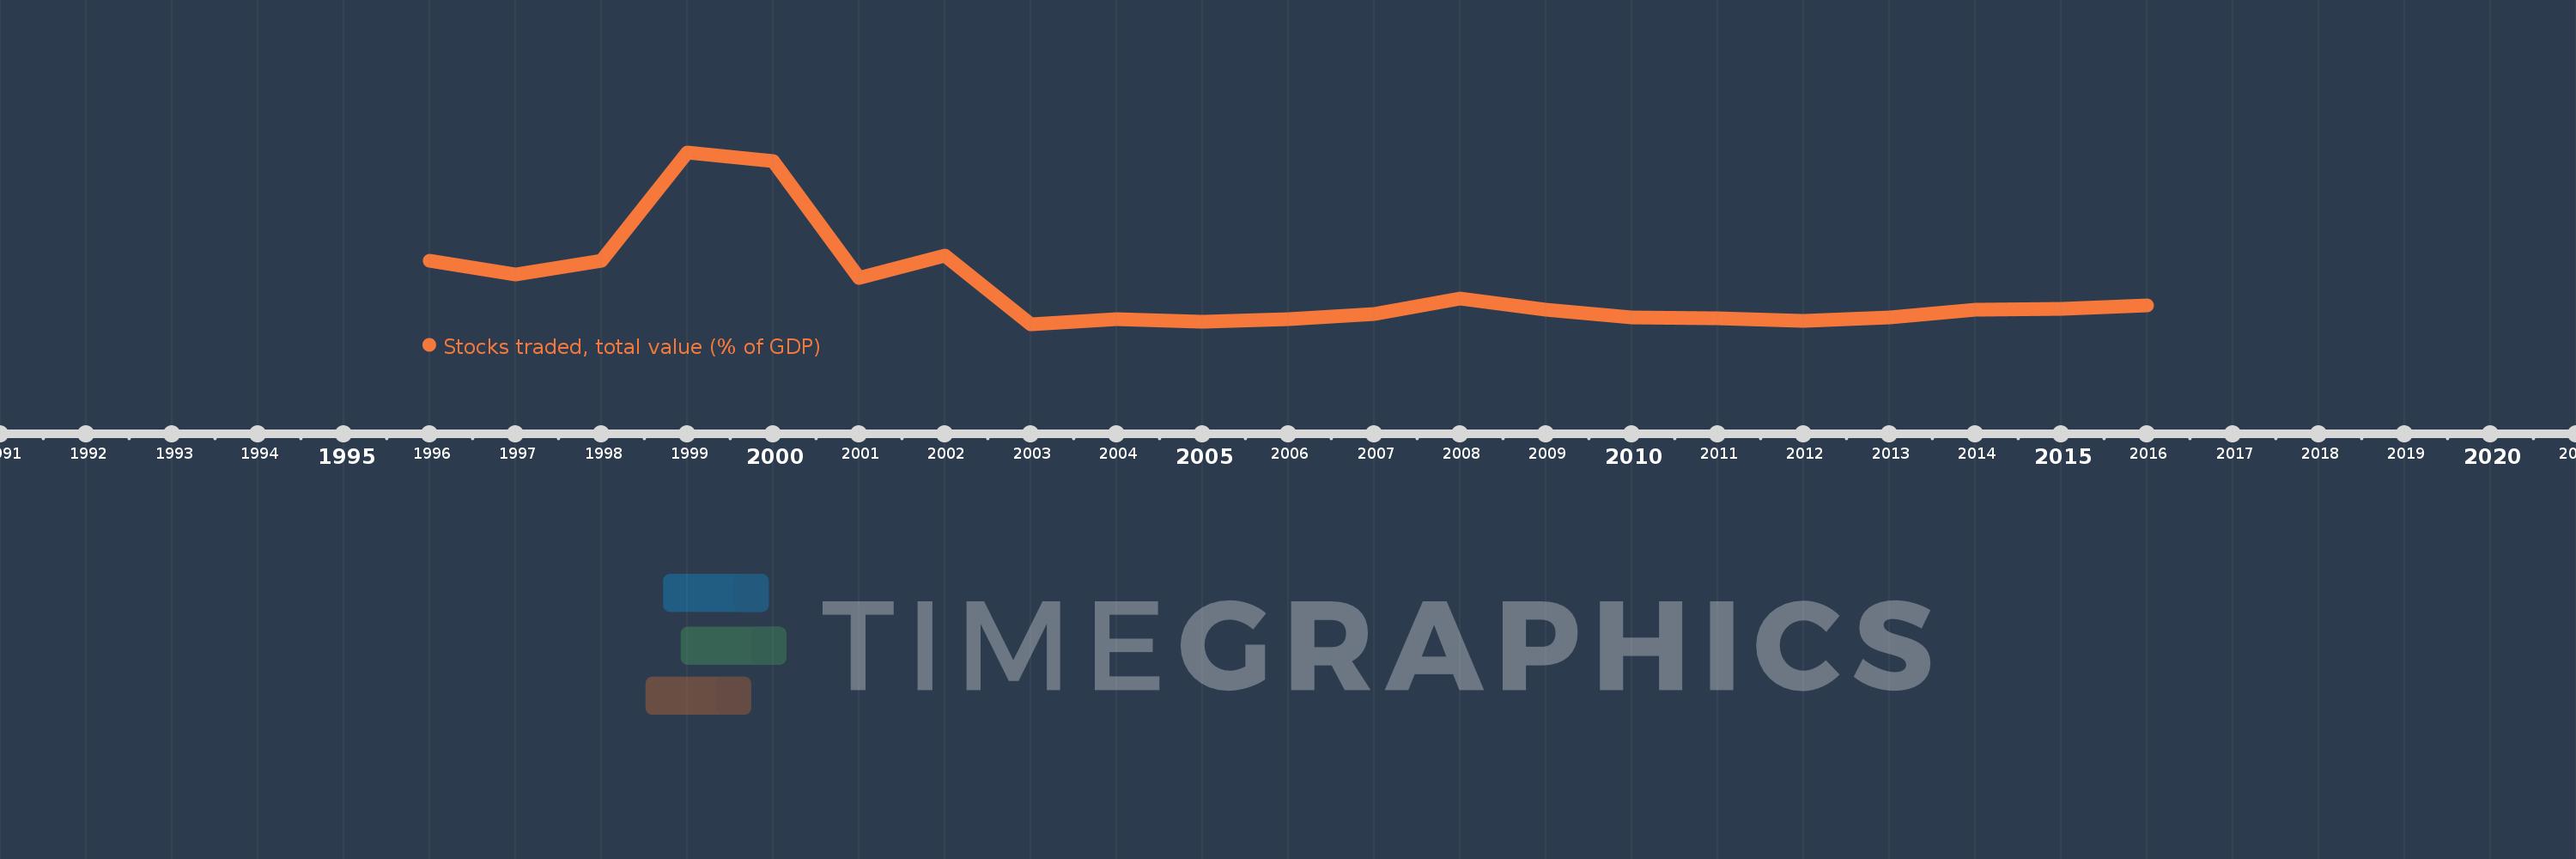
En esta escala de tiempo se presenta un gráfico de 1996 y 2016 de Ireland. Los datos de 1995 están ausentes. El número de observaciones reales por fecha: 21.
Fuente (nombre):
Indicadores del desarrollo mundial
Fuente (organización):
World Federation of Exchanges database.
Categorías:
Financial Sector
Se ha actualizado:
23 abr 2017 año
Los indicadores de los cambios de valor en los últimos años
En promedio:
12.02
Mínimo:
2.454
1 ene 2003 año
Máximo:
47.829
1 ene 1999 año
A la fecha de observación
Valor
Cambio absoluto
El cambio con respecto al valor anterior
1 ene 1996 año
19.257
+19.257
0.0%
1 ene 1997 año
15.547
-3.71
-19.27%
1 ene 1998 año
19.324
+3.777
24.3%
1 ene 1999 año
47.829
+28.505
147.51%
1 ene 2000 año
45.636
-2.193
-4.58%
1 ene 2001 año
14.735
-30.901
-67.71%
1 ene 2002 año
20.605
+5.87
39.83%
1 ene 2003 año
2.454
-18.151
-88.09%
1 ene 2004 año
3.715
+1.261
51.4%
1 ene 2005 año
3.083
-0.632
-17.02%
1 ene 2006 año
3.688
+0.605
19.61%
1 ene 2007 año
5.203
+1.515
41.09%
1 ene 2008 año
9.132
+3.929
75.52%
1 ene 2009 año
6.388
-2.744
-30.05%
1 ene 2010 año
4.191
-2.197
-34.4%
1 ene 2011 año
4.007
-0.184
-4.39%
1 ene 2012 año
3.397
-0.61
-15.23%
1 ene 2013 año
4.151
+0.755
22.22%
1 ene 2014 año
6.228
+2.077
50.02%
1 ene 2015 año
6.467
+0.24
3.85%
1 ene 2016 año
7.377
+0.91
14.07%
Ranking de los países por los datos estadísticos actuales

Comentarios:

Enviar
PremiumAbout & FeedbackAcuerdoPrivacidad
logo
© 2022 Selected Technologies LLC – Morgan Hill, California