33
/es/
AIzaSyAYiBZKx7MnpbEhh9jyipgxe19OcubqV5w
May 1, 2025
243149
Slovenia
SVN
true
2
1
Stocks traded, total value (% of GDP)
2016,2015,2014,2013,2012,2011,2010,2009,2008,2007,2006,2005,2004,2003,2002,2001,2000,1999,1998,1997,1996
Download
Estadísticas Globales de la Biblioteca →Slovenia →

Stocks traded, total value (% of GDP)

Estas estadísticas en otros países:

Arab WorldArgentinaArmeniaAustraliaAustriaBahrainBangladeshBarbadosBelgiumBermudaBoliviaBotswanaBrazilBulgariaCanadaCayman IslandsCentral Europe and the BalticsChannel IslandsChileChinaColombiaCosta RicaCote d'IvoireCroatiaCyprusCzech RepublicDenmarkEarly-demographic dividendEast Asia & PacificEast Asia & Pacific (excluding high income)East Asia & Pacific (IDA & IBRD countries)EcuadorEgypt, Arab Rep.El SalvadorEstoniaEuro areaEurope & Central AsiaEurope & Central Asia (excluding high income)Europe & Central Asia (IDA & IBRD countries)European UnionFijiFinlandFranceGeorgiaGermanyGhanaGreeceGuyanaHigh incomeHong Kong SAR, ChinaHungaryIBRD onlyIcelandIDA & IBRD totalIDA blendIDA totalIndiaIndonesiaIran, Islamic Rep.IrelandIsraelItalyJamaicaJapanJordanKazakhstanKenyaKorea, Rep.KuwaitKyrgyz RepublicLate-demographic dividendLatin America & Caribbean Latin America & Caribbean (excluding high income)Latin America & the Caribbean (IDA & IBRD countries)LatviaLebanonLithuaniaLow & middle incomeLower middle incomeLuxembourgMacedonia, FYRMalawiMalaysiaMaltaMauritiusMexicoMiddle East & North AfricaMiddle East & North Africa (excluding high income)Middle East & North Africa (IDA & IBRD countries)Middle incomeMoldovaMongoliaMontenegroMoroccoNamibiaNetherlandsNew ZealandNigeriaNorth AmericaNorwayOECD membersOmanOther small statesPakistanPanamaPapua New GuineaParaguayPeruPhilippinesPolandPortugalPost-demographic dividendQatarRomaniaRussian FederationSaudi ArabiaSerbiaSeychellesSingaporeSlovak RepublicSloveniaSouth AfricaSouth AsiaSouth Asia (IDA & IBRD)SpainSri LankaSt. Kitts and NevisSub-Saharan Africa Sub-Saharan Africa (excluding high income)Sub-Saharan Africa (IDA & IBRD countries)SwazilandSwedenSwitzerlandTanzaniaThailandTrinidad and TobagoTunisiaTurkeyUgandaUkraineUnited Arab EmiratesUnited KingdomUnited StatesUpper middle incomeUruguayUzbekistanVenezuela, RBVietnamWest Bank and GazaWorldZambiaZimbabwe

línea de tiempo (timeline):

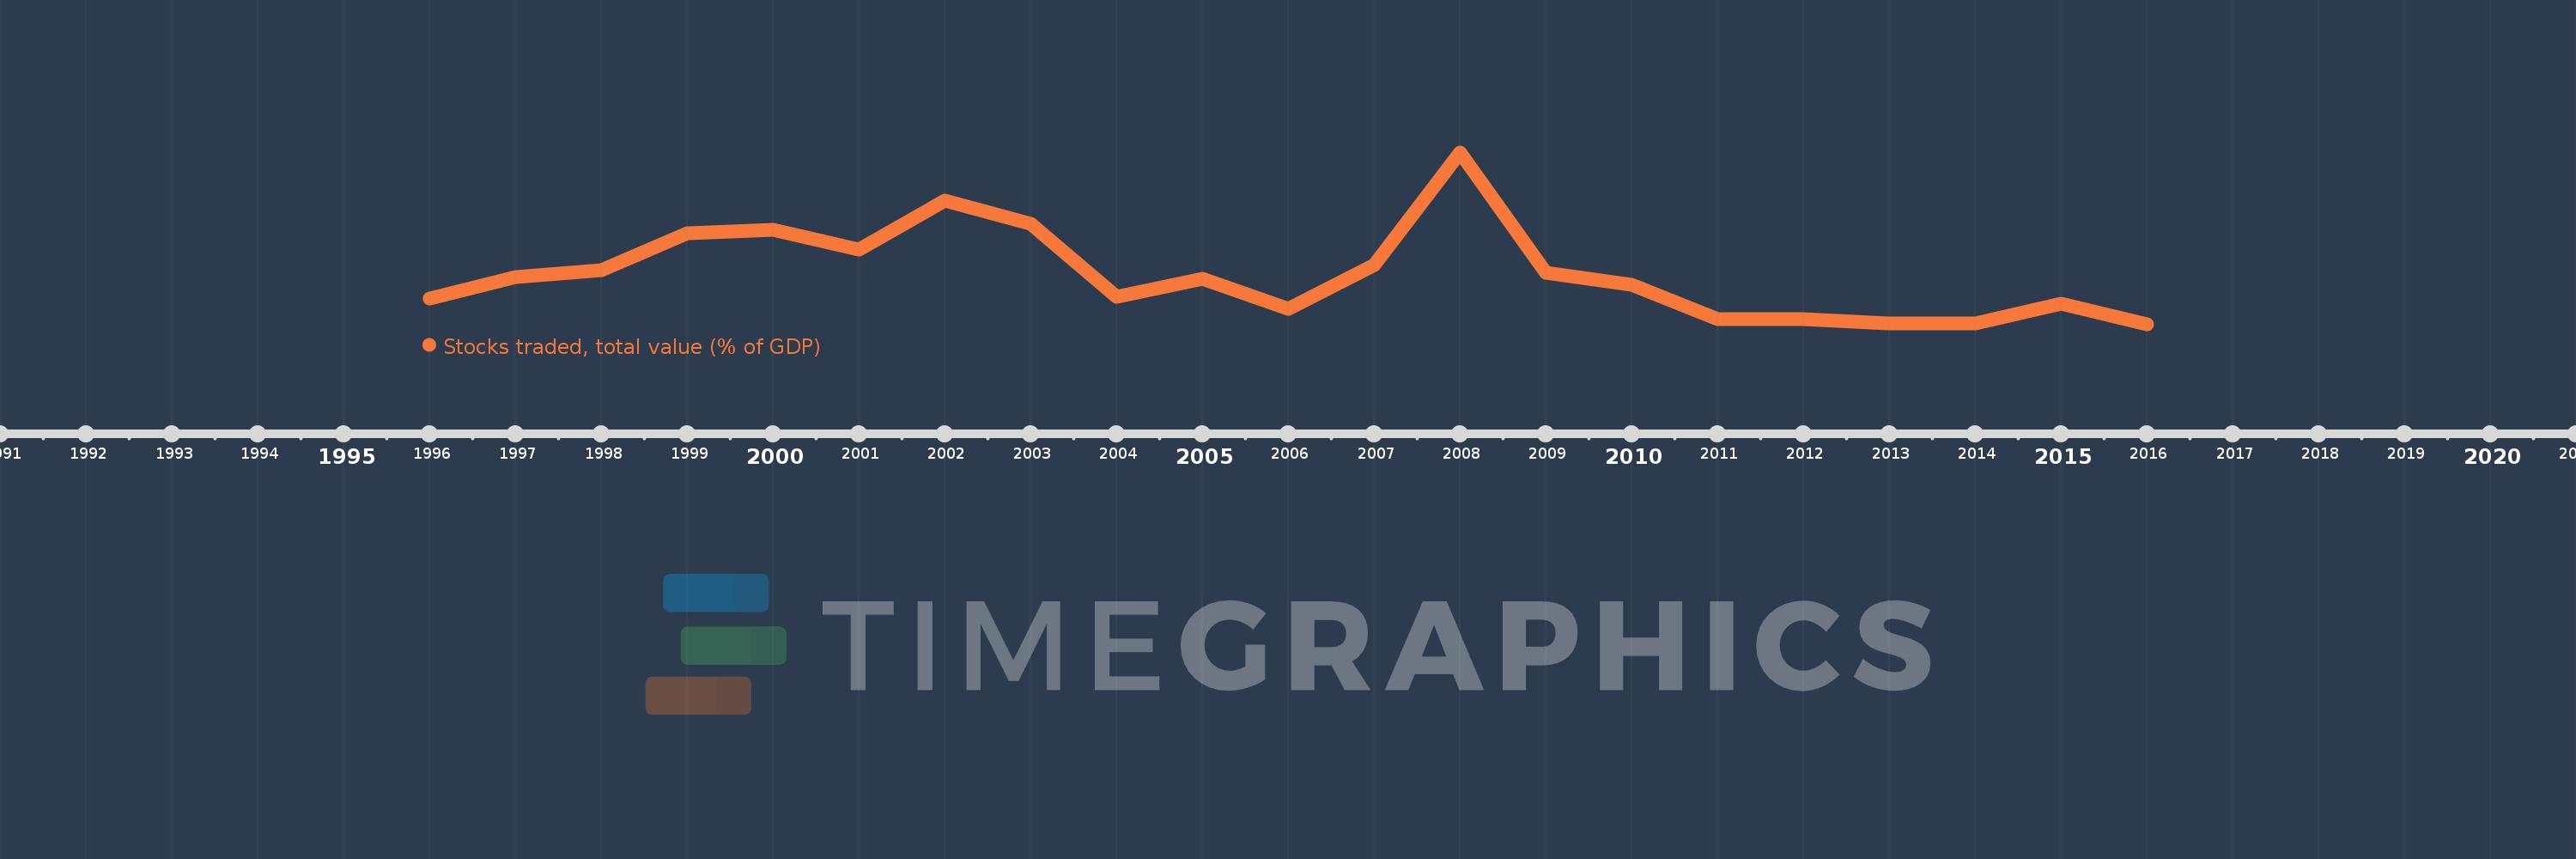
En esta escala de tiempo se presenta un gráfico de 1996 y 2016 de Slovenia. Los datos de 1995 están ausentes. El número de observaciones reales por fecha: 21.

Fuente (nombre):

Indicadores del desarrollo mundial

Fuente (organización):

World Federation of Exchanges database.

Categorías:

Financial Sector

Se ha actualizado:

23 abr 2017 año

Los indicadores de los cambios de valor en los últimos años

En promedio:
2.385
Mínimo:
0.852
1 ene 2016 año
Máximo:
6.103
1 ene 2008 año
A la fecha de observación
Valor
Cambio absoluto
El cambio con respecto al valor anterior
1 ene 1996 año
1.636
+1.636
0.0%
1 ene 1997 año
2.3
+0.664
40.57%
1 ene 1998 año
2.505
+0.205
8.89%
1 ene 1999 año
3.643
+1.138
45.44%
1 ene 2000 año
3.739
+0.096
2.63%
1 ene 2001 año
3.141
-0.598
-16.0%
1 ene 2002 año
4.626
+1.485
47.3%
1 ene 2003 año
3.932
-0.694
-15.0%
1 ene 2004 año
1.684
-2.248
-57.16%
1 ene 2005 año
2.237
+0.553
32.83%
1 ene 2006 año
1.31
-0.928
-41.46%
1 ene 2007 año
2.668
+1.359
103.74%
1 ene 2008 año
6.103
+3.435
128.72%
1 ene 2009 año
2.433
-3.671
-60.14%
1 ene 2010 año
2.056
-0.377
-15.5%
1 ene 2011 año
1.008
-1.048
-50.96%
1 ene 2012 año
0.998
-0.01
-0.95%
1 ene 2013 año
0.865
-0.134
-13.42%
1 ene 2014 año
0.865
+0.001
0.07%
1 ene 2015 año
1.486
+0.62
71.72%
1 ene 2016 año
0.852
-0.633
-42.64%

Ranking de los países por los datos estadísticos actuales