30
/es/
AIzaSyAYiBZKx7MnpbEhh9jyipgxe19OcubqV5w
April 1, 2024
225415
Poland
POL
true
2
1
Stocks traded, total value (% of GDP)
2016,2015,2014,2013,2012,2011,2010,2009,2008,2007,2006,2005,2004,2003,2002,2001,2000,1999,1998,1997,1996,1995,1994,1993,1992
Download
Estadísticas Globales de la Biblioteca →Poland →

Stocks traded, total value (% of GDP)

Estas estadísticas en otros países:

Arab WorldArgentinaArmeniaAustraliaAustriaBahrainBangladeshBarbadosBelgiumBermudaBoliviaBotswanaBrazilBulgariaCanadaCayman IslandsCentral Europe and the BalticsChannel IslandsChileChinaColombiaCosta RicaCote d'IvoireCroatiaCyprusCzech RepublicDenmarkEarly-demographic dividendEast Asia & PacificEast Asia & Pacific (excluding high income)East Asia & Pacific (IDA & IBRD countries)EcuadorEgypt, Arab Rep.El SalvadorEstoniaEuro areaEurope & Central AsiaEurope & Central Asia (excluding high income)Europe & Central Asia (IDA & IBRD countries)European UnionFijiFinlandFranceGeorgiaGermanyGhanaGreeceGuyanaHigh incomeHong Kong SAR, ChinaHungaryIBRD onlyIcelandIDA & IBRD totalIDA blendIDA totalIndiaIndonesiaIran, Islamic Rep.IrelandIsraelItalyJamaicaJapanJordanKazakhstanKenyaKorea, Rep.KuwaitKyrgyz RepublicLate-demographic dividendLatin America & Caribbean Latin America & Caribbean (excluding high income)Latin America & the Caribbean (IDA & IBRD countries)LatviaLebanonLithuaniaLow & middle incomeLower middle incomeLuxembourgMacedonia, FYRMalawiMalaysiaMaltaMauritiusMexicoMiddle East & North AfricaMiddle East & North Africa (excluding high income)Middle East & North Africa (IDA & IBRD countries)Middle incomeMoldovaMongoliaMontenegroMoroccoNamibiaNetherlandsNew ZealandNigeriaNorth AmericaNorwayOECD membersOmanOther small statesPakistanPanamaPapua New GuineaParaguayPeruPhilippinesPolandPortugalPost-demographic dividendQatarRomaniaRussian FederationSaudi ArabiaSerbiaSeychellesSingaporeSlovak RepublicSloveniaSouth AfricaSouth AsiaSouth Asia (IDA & IBRD)SpainSri LankaSt. Kitts and NevisSub-Saharan Africa Sub-Saharan Africa (excluding high income)Sub-Saharan Africa (IDA & IBRD countries)SwazilandSwedenSwitzerlandTanzaniaThailandTrinidad and TobagoTunisiaTurkeyUgandaUkraineUnited Arab EmiratesUnited KingdomUnited StatesUpper middle incomeUruguayUzbekistanVenezuela, RBVietnamWest Bank and GazaWorldZambiaZimbabwe

línea de tiempo (timeline):

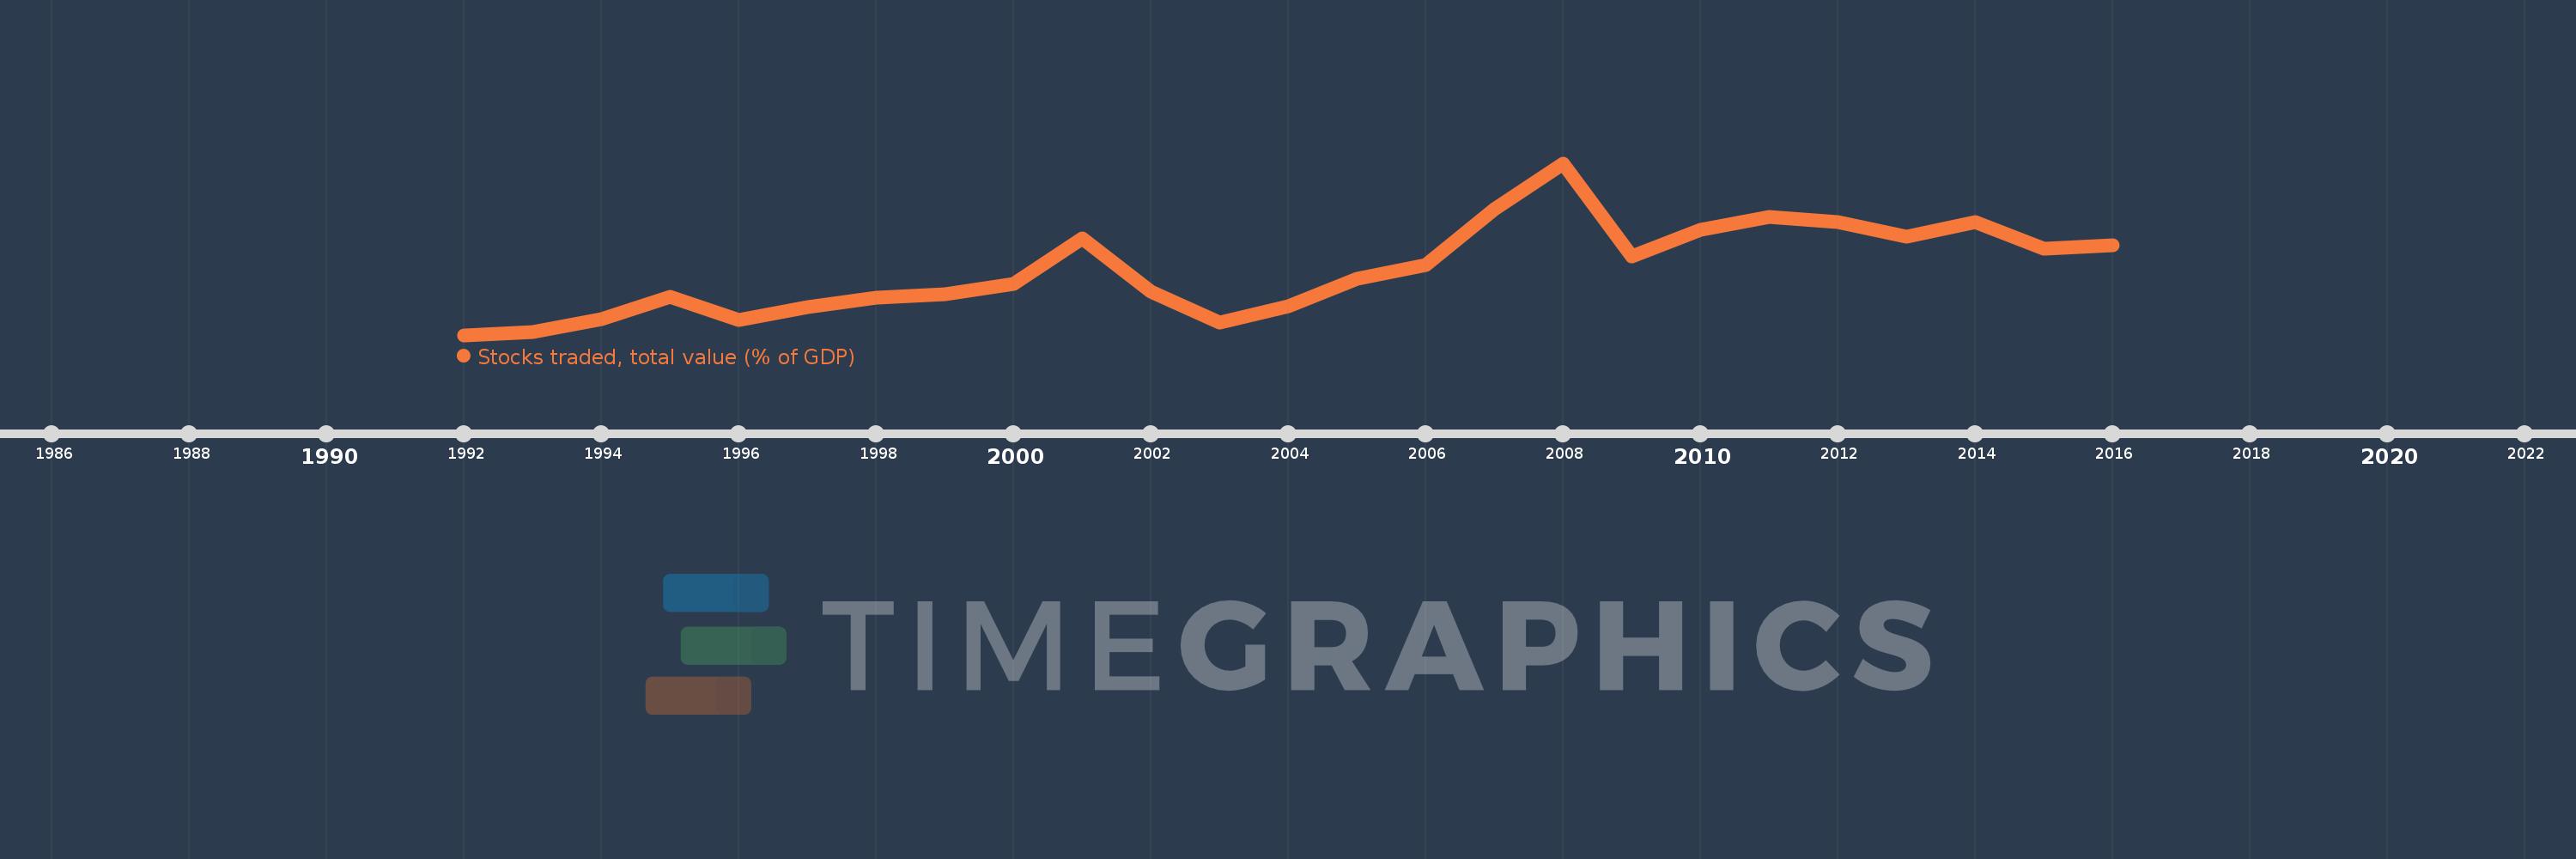
En esta escala de tiempo se presenta un gráfico de 1992 y 2016 de Poland. Los datos de 1991 están ausentes. El número de observaciones reales por fecha: 25.

Fuente (nombre):

Indicadores del desarrollo mundial

Fuente (organización):

World Federation of Exchanges database.

Categorías:

Financial Sector

Se ha actualizado:

23 abr 2017 año

Los indicadores de los cambios de valor en los últimos años

En promedio:
8.065
Mínimo:
0.097
1 ene 1992 año
Máximo:
21.006
1 ene 2008 año
A la fecha de observación
Valor
Cambio absoluto
El cambio con respecto al valor anterior
1 ene 1992 año
0.097
+0.097
0.0%
1 ene 1993 año
0.442
+0.345
355.35%
1 ene 1994 año
2.056
+1.614
365.22%
1 ene 1995 año
4.699
+2.643
128.51%
1 ene 1996 año
1.948
-2.751
-58.54%
1 ene 1997 año
3.466
+1.518
77.91%
1 ene 1998 año
4.666
+1.2
34.62%
1 ene 1999 año
5.088
+0.422
9.04%
1 ene 2000 año
6.331
+1.243
24.44%
1 ene 2001 año
11.903
+5.572
88.0%
1 ene 2002 año
5.342
-6.561
-55.12%
1 ene 2003 año
1.632
-3.71
-69.45%
1 ene 2004 año
3.569
+1.937
118.71%
1 ene 2005 año
6.98
+3.41
95.55%
1 ene 2006 año
8.572
+1.592
22.81%
1 ene 2007 año
15.438
+6.866
80.1%
1 ene 2008 año
21.006
+5.568
36.07%
1 ene 2009 año
9.683
-11.323
-53.9%
1 ene 2010 año
12.876
+3.193
32.98%
1 ene 2011 año
14.487
+1.611
12.51%
1 ene 2012 año
13.816
-0.671
-4.63%
1 ene 2013 año
12.037
-1.779
-12.87%
1 ene 2014 año
13.852
+1.814
15.07%
1 ene 2015 año
10.601
-3.25
-23.46%
1 ene 2016 año
11.032
+0.43
4.06%

Ranking de los países por los datos estadísticos actuales