29
/es/
es
AIzaSyAYiBZKx7MnpbEhh9jyipgxe19OcubqV5w
April 1, 2024
141142
Ghana
GHA
true
2
1
Stocks traded, total value (% of GDP)
2014,2013,2012,2011,2010,2009,2008,2007,2006,2005,2004,2003,2002,2001,2000,1999,1998,1997,1996,1995,1994
Download
Estadísticas Globales de la Biblioteca →Ghana →

Stocks traded, total value (% of GDP)

Estas estadísticas en otros países:
Arab WorldArgentinaArmeniaAustraliaAustriaBahrainBangladeshBarbadosBelgiumBermudaBoliviaBotswanaBrazilBulgariaCanadaCayman IslandsCentral Europe and the BalticsChannel IslandsChileChinaColombiaCosta RicaCote d'IvoireCroatiaCyprusCzech RepublicDenmarkEarly-demographic dividendEast Asia & PacificEast Asia & Pacific (excluding high income)East Asia & Pacific (IDA & IBRD countries)EcuadorEgypt, Arab Rep.El SalvadorEstoniaEuro areaEurope & Central AsiaEurope & Central Asia (excluding high income)Europe & Central Asia (IDA & IBRD countries)European UnionFijiFinlandFranceGeorgiaGermanyGhanaGreeceGuyanaHigh incomeHong Kong SAR, ChinaHungaryIBRD onlyIcelandIDA & IBRD totalIDA blendIDA totalIndiaIndonesiaIran, Islamic Rep.IrelandIsraelItalyJamaicaJapanJordanKazakhstanKenyaKorea, Rep.KuwaitKyrgyz RepublicLate-demographic dividendLatin America & Caribbean Latin America & Caribbean (excluding high income)Latin America & the Caribbean (IDA & IBRD countries)LatviaLebanonLithuaniaLow & middle incomeLower middle incomeLuxembourgMacedonia, FYRMalawiMalaysiaMaltaMauritiusMexicoMiddle East & North AfricaMiddle East & North Africa (excluding high income)Middle East & North Africa (IDA & IBRD countries)Middle incomeMoldovaMongoliaMontenegroMoroccoNamibiaNetherlandsNew ZealandNigeriaNorth AmericaNorwayOECD membersOmanOther small statesPakistanPanamaPapua New GuineaParaguayPeruPhilippinesPolandPortugalPost-demographic dividendQatarRomaniaRussian FederationSaudi ArabiaSerbiaSeychellesSingaporeSlovak RepublicSloveniaSouth AfricaSouth AsiaSouth Asia (IDA & IBRD)SpainSri LankaSt. Kitts and NevisSub-Saharan Africa Sub-Saharan Africa (excluding high income)Sub-Saharan Africa (IDA & IBRD countries)SwazilandSwedenSwitzerlandTanzaniaThailandTrinidad and TobagoTunisiaTurkeyUgandaUkraineUnited Arab EmiratesUnited KingdomUnited StatesUpper middle incomeUruguayUzbekistanVenezuela, RBVietnamWest Bank and GazaWorldZambiaZimbabwe
línea de tiempo (timeline):
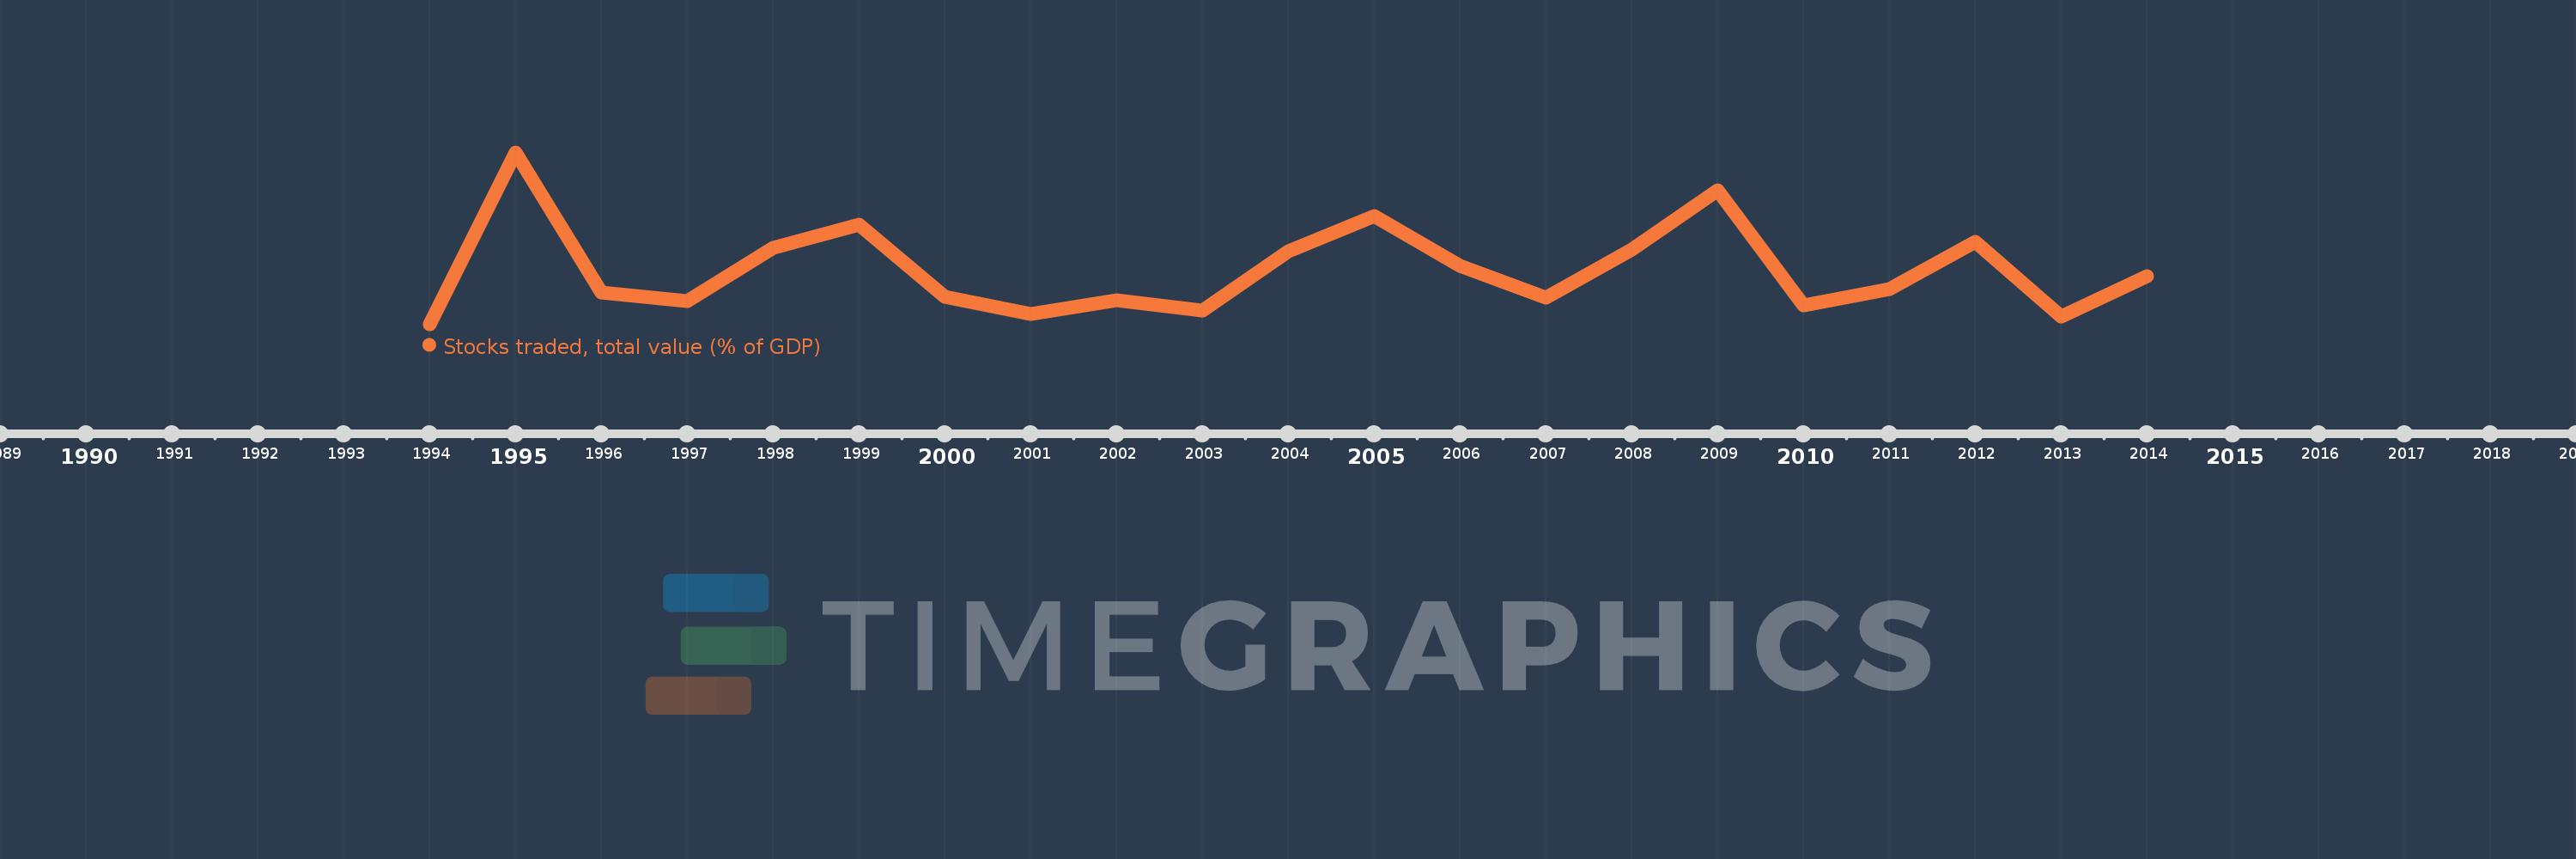
En esta escala de tiempo se presenta un gráfico de 1994 y 2014 de Ghana. Los datos de 1993 están ausentes. El número de observaciones reales por fecha: 21.
Fuente (nombre):
Indicadores del desarrollo mundial
Fuente (organización):
World Federation of Exchanges database.
Categorías:
Financial Sector
Se ha actualizado:
23 abr 2017 año
Los indicadores de los cambios de valor en los últimos años
En promedio:
0.449
Mínimo:
0.069
1 ene 1994 año
Máximo:
1.267
1 ene 1995 año
A la fecha de observación
Valor
Cambio absoluto
El cambio con respecto al valor anterior
1 ene 1994 año
0.069
+0.069
0.0%
1 ene 1995 año
1.267
+1.199
1.74 mil%
1 ene 1996 año
0.292
-0.976
-76.99%
1 ene 1997 año
0.233
-0.059
-20.13%
1 ene 1998 año
0.599
+0.367
157.41%
1 ene 1999 año
0.766
+0.166
27.71%
1 ene 2000 año
0.258
-0.508
-66.34%
1 ene 2001 año
0.14
-0.118
-45.79%
1 ene 2002 año
0.235
+0.096
68.38%
1 ene 2003 año
0.162
-0.073
-31.05%
1 ene 2004 año
0.576
+0.414
255.4%
1 ene 2005 año
0.821
+0.244
42.38%
1 ene 2006 año
0.475
-0.345
-42.09%
1 ene 2007 año
0.253
-0.222
-46.8%
1 ene 2008 año
0.587
+0.334
132.28%
1 ene 2009 año
1.005
+0.418
71.19%
1 ene 2010 año
0.199
-0.806
-80.17%
1 ene 2011 año
0.316
+0.117
58.67%
1 ene 2012 año
0.642
+0.326
102.98%
1 ene 2013 año
0.122
-0.521
-81.07%
1 ene 2014 año
0.404
+0.282
231.83%
Ranking de los países por los datos estadísticos actuales

Comentarios:

Enviar
PremiumAbout & FeedbackAcuerdoPrivacidad
logo
© 2022 Selected Technologies LLC – Morgan Hill, California