29
/es/
es
AIzaSyAYiBZKx7MnpbEhh9jyipgxe19OcubqV5w
April 1, 2024
249512
Sri Lanka
LKA
true
2
1
Tax revenue (current LCU)
2015,2014,2013,2012,2011,2010,2009,2008,2007,2006,2005,2004,2003,2002,2001,2000,1999,1998,1997,1996,1995,1994,1993,1992,1991
Download
Estadísticas Globales de la Biblioteca →Sri Lanka →

Tax revenue (current LCU)

Estas estadísticas en otros países:
AfghanistanAlbaniaAlgeriaAngolaAntigua and BarbudaArgentinaArmeniaAustraliaAustriaAzerbaijanBahamas, TheBahrainBangladeshBarbadosBelarusBelgiumBelizeBeninBhutanBoliviaBosnia and HerzegovinaBotswanaBrazilBulgariaBurkina FasoBurundiCabo VerdeCambodiaCanadaCentral African RepublicChileChinaColombiaCongo, Dem. Rep.Congo, Rep.Costa RicaCote d'IvoireCroatiaCyprusCzech RepublicDenmarkDominicaDominican RepublicEgypt, Arab Rep.El SalvadorEquatorial GuineaEstoniaEthiopiaFijiFinlandFranceGambia, TheGeorgiaGermanyGhanaGreeceGrenadaGuatemalaHondurasHong Kong SAR, ChinaHungaryIcelandIndiaIndonesiaIran, Islamic Rep.IraqIrelandIsraelItalyJamaicaJapanJordanKazakhstanKenyaKiribatiKorea, Rep.KuwaitKyrgyz RepublicLao PDRLatviaLebanonLesothoLiberiaLithuaniaLuxembourgMacao SAR, ChinaMacedonia, FYRMadagascarMalawiMalaysiaMaldivesMaliMaltaMauritiusMexicoMicronesia, Fed. Sts.MoldovaMongoliaMoroccoMozambiqueMyanmarNamibiaNepalNetherlandsNew ZealandNicaraguaNigeriaNorwayOmanPakistanPanamaPapua New GuineaParaguayPeruPhilippinesPolandPortugalQatarRomaniaRussian FederationRwandaSamoaSan MarinoSao Tome and PrincipeSenegalSerbiaSeychellesSierra LeoneSingaporeSlovak RepublicSloveniaSolomon IslandsSouth AfricaSpainSri LankaSt. Kitts and NevisSt. LuciaSt. Vincent and the GrenadinesSurinameSwazilandSwedenSwitzerlandSyrian Arab RepublicTajikistanTanzaniaThailandTimor-LesteTogoTrinidad and TobagoTunisiaTurkeyUgandaUkraineUnited Arab EmiratesUnited KingdomUnited StatesUruguayVanuatuVenezuela, RBVietnamWest Bank and GazaYemen, Rep.ZambiaZimbabwe
línea de tiempo (timeline):
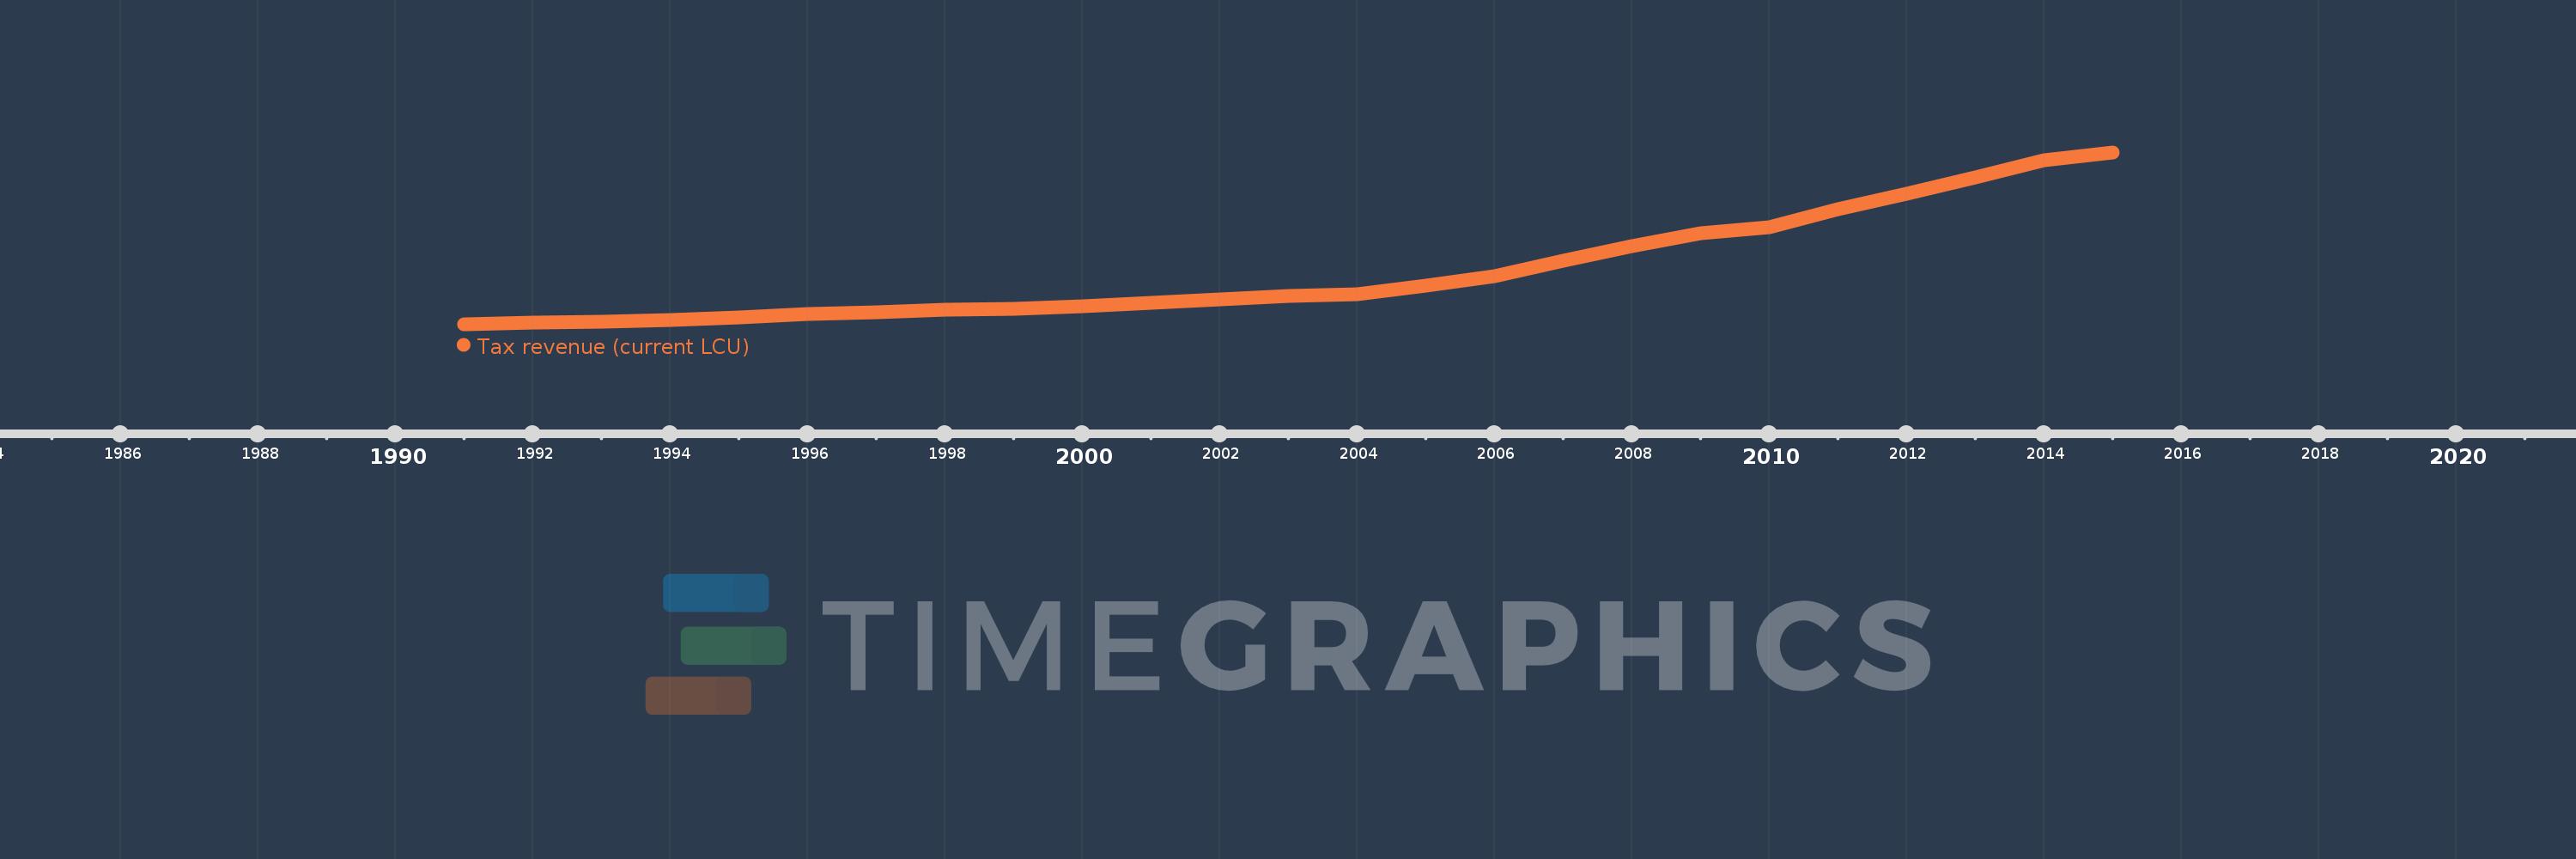
En esta escala de tiempo se presenta un gráfico de 1991 y 2015 de Sri Lanka. Los datos de 1990 están ausentes. El número de observaciones reales por fecha: 25.
Fuente (nombre):
Indicadores del desarrollo mundial
Fuente (organización):
International Monetary Fund, Government Finance Statistics Yearbook and data files.
Categorías:
Public Sector
Se ha actualizado:
23 abr 2017 año
Los indicadores de los cambios de valor en los últimos años
En promedio:
368.06 bn
Mínimo:
61.206 bn
1 ene 1991 año
Máximo:
1.05 billones
1 ene 2015 año
A la fecha de observación
Valor
Cambio absoluto
El cambio con respecto al valor anterior
1 ene 1991 año
61.206 bn
+61.206 bn
0.0%
1 ene 1992 año
68.157 bn
+6.951 bn
11.36%
1 ene 1993 año
76.353 bn
+8.196 bn
12.03%
1 ene 1994 año
87.274 bn
+10.921 bn
14.3%
1 ene 1995 año
99.417 bn
+12.143 bn
13.91%
1 ene 1996 año
118.543 bn
+19.126 bn
19.24%
1 ene 1997 año
130.203 bn
+11.66 bn
9.84%
1 ene 1998 año
142.512 bn
+12.309 bn
9.45%
1 ene 1999 año
147.368 bn
+4.856 bn
3.41%
1 ene 2000 año
166.028 bn
+18.66 bn
12.66%
1 ene 2001 año
182.392 bn
+16.364 bn
9.86%
1 ene 2002 año
205.839 bn
+23.447 bn
12.86%
1 ene 2003 año
221.786 bn
+15.947 bn
7.75%
1 ene 2004 año
231.648 bn
+9.862 bn
4.45%
1 ene 2005 año
281.552 bn
+49.904 bn
21.54%
1 ene 2006 año
336.829 bn
+55.277 bn
19.63%
1 ene 2007 año
428.379 bn
+91.55 bn
27.18%
1 ene 2008 año
508.947 bn
+80.568 bn
18.81%
1 ene 2009 año
585.621 bn
+76.674 bn
15.07%
1 ene 2010 año
618.933 bn
+33.312 bn
5.69%
1 ene 2011 año
724.746 bn
+105.813 bn
17.1%
1 ene 2012 año
812.611 bn
+87.865 bn
12.12%
1 ene 2013 año
908.911 bn
+96.3 bn
11.85%
1 ene 2014 año
1.006 billones
+96.979 bn
10.67%
1 ene 2015 año
1.05 billones
+44.472 bn
4.42%
Ranking de los países por los datos estadísticos actuales

Comentarios:

Enviar
PremiumAbout & FeedbackAcuerdoPrivacidad
logo
© 2022 Selected Technologies LLC – Morgan Hill, California