33
/es/
AIzaSyAYiBZKx7MnpbEhh9jyipgxe19OcubqV5w
August 1, 2025
145148
Guatemala
GTM
true
2
1
Tax revenue (current LCU)
2014,2013,2012,2011,2010,2009,2008,2007,2006,2005,2004,2003,2002,2001,2000,1999,1998,1997,1996,1995,1994,1993,1992,1991
Download
Estadísticas Globales de la Biblioteca →Guatemala →

Tax revenue (current LCU)

Estas estadísticas en otros países:

AfghanistanAlbaniaAlgeriaAngolaAntigua and BarbudaArgentinaArmeniaAustraliaAustriaAzerbaijanBahamas, TheBahrainBangladeshBarbadosBelarusBelgiumBelizeBeninBhutanBoliviaBosnia and HerzegovinaBotswanaBrazilBulgariaBurkina FasoBurundiCabo VerdeCambodiaCanadaCentral African RepublicChileChinaColombiaCongo, Dem. Rep.Congo, Rep.Costa RicaCote d'IvoireCroatiaCyprusCzech RepublicDenmarkDominicaDominican RepublicEgypt, Arab Rep.El SalvadorEquatorial GuineaEstoniaEthiopiaFijiFinlandFranceGambia, TheGeorgiaGermanyGhanaGreeceGrenadaGuatemalaHondurasHong Kong SAR, ChinaHungaryIcelandIndiaIndonesiaIran, Islamic Rep.IraqIrelandIsraelItalyJamaicaJapanJordanKazakhstanKenyaKiribatiKorea, Rep.KuwaitKyrgyz RepublicLao PDRLatviaLebanonLesothoLiberiaLithuaniaLuxembourgMacao SAR, ChinaMacedonia, FYRMadagascarMalawiMalaysiaMaldivesMaliMaltaMauritiusMexicoMicronesia, Fed. Sts.MoldovaMongoliaMoroccoMozambiqueMyanmarNamibiaNepalNetherlandsNew ZealandNicaraguaNigeriaNorwayOmanPakistanPanamaPapua New GuineaParaguayPeruPhilippinesPolandPortugalQatarRomaniaRussian FederationRwandaSamoaSan MarinoSao Tome and PrincipeSenegalSerbiaSeychellesSierra LeoneSingaporeSlovak RepublicSloveniaSolomon IslandsSouth AfricaSpainSri LankaSt. Kitts and NevisSt. LuciaSt. Vincent and the GrenadinesSurinameSwazilandSwedenSwitzerlandSyrian Arab RepublicTajikistanTanzaniaThailandTimor-LesteTogoTrinidad and TobagoTunisiaTurkeyUgandaUkraineUnited Arab EmiratesUnited KingdomUnited StatesUruguayVanuatuVenezuela, RBVietnamWest Bank and GazaYemen, Rep.ZambiaZimbabwe

línea de tiempo (timeline):

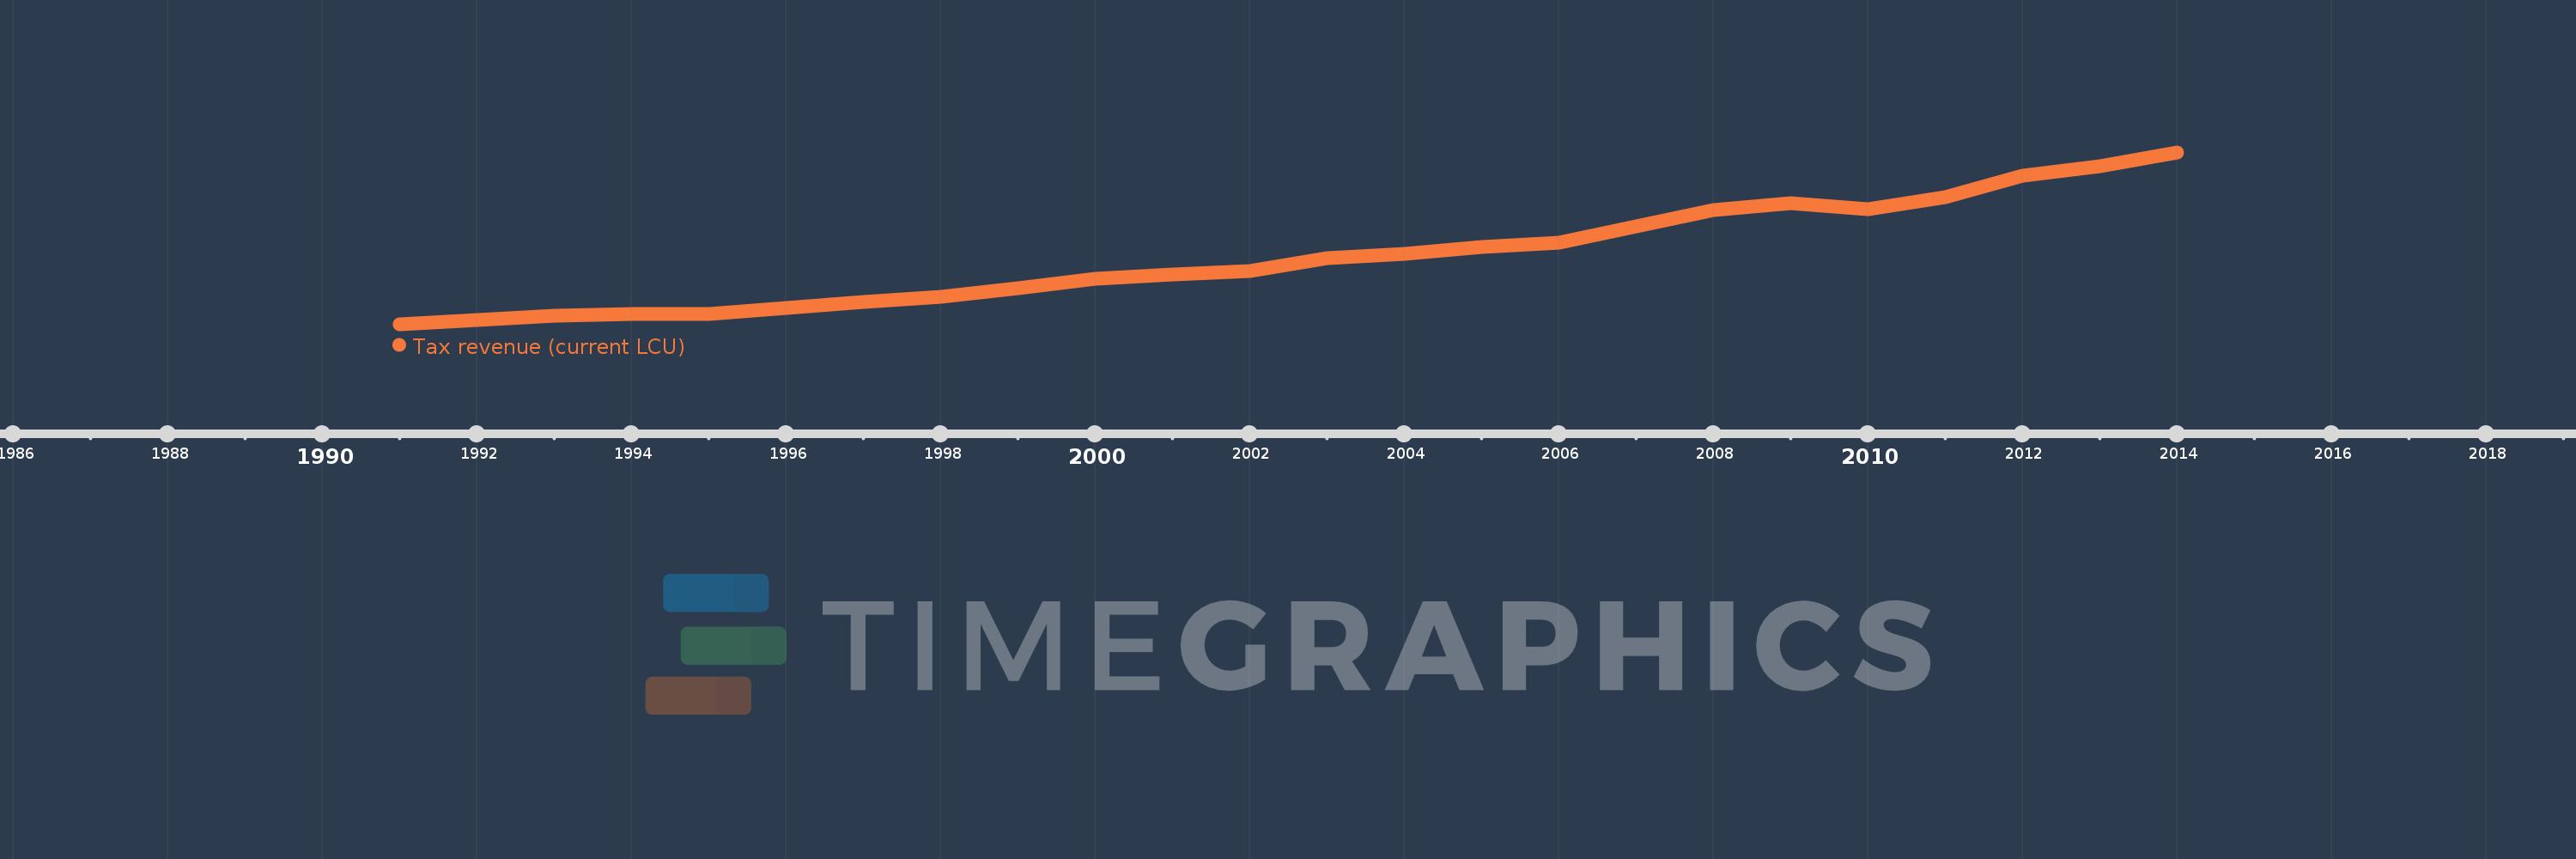
En esta escala de tiempo se presenta un gráfico de 1991 y 2014 de Guatemala. Los datos de 1990 están ausentes. El número de observaciones reales por fecha: 24.

Fuente (nombre):

Indicadores del desarrollo mundial

Fuente (organización):

International Monetary Fund, Government Finance Statistics Yearbook and data files.

Categorías:

Public Sector

Se ha actualizado:

23 abr 2017 año

Los indicadores de los cambios de valor en los últimos años

En promedio:
19.745 bn
Mínimo:
2.356 bn
1 ene 1991 año
Máximo:
46.228 bn
1 ene 2014 año
A la fecha de observación
Valor
Cambio absoluto
El cambio con respecto al valor anterior
1 ene 1991 año
2.356 bn
+2.356 bn
0.0%
1 ene 1992 año
3.465 bn
+1.109 bn
47.09%
1 ene 1993 año
4.488 bn
+1.023 bn
29.52%
1 ene 1994 año
5.024 bn
+535.39 millones
11.93%
1 ene 1995 año
5.052 bn
+27.83 millones
0.55%
1 ene 1996 año
6.57 bn
+1.518 bn
30.05%
1 ene 1997 año
8.144 bn
+1.574 bn
23.96%
1 ene 1998 año
9.382 bn
+1.238 bn
15.21%
1 ene 1999 año
11.623 bn
+2.241 bn
23.88%
1 ene 2000 año
13.863 bn
+2.24 bn
19.27%
1 ene 2001 año
15.072 bn
+1.209 bn
8.72%
1 ene 2002 año
15.966 bn
+894.64 millones
5.94%
1 ene 2003 año
19.307 bn
+3.34 bn
20.92%
1 ene 2004 año
20.318 bn
+1.011 bn
5.24%
1 ene 2005 año
22.001 bn
+1.683 bn
8.29%
1 ene 2006 año
23.277 bn
+1.276 bn
5.8%
1 ene 2007 año
27.252 bn
+3.975 bn
17.08%
1 ene 2008 año
31.567 bn
+4.315 bn
15.83%
1 ene 2009 año
33.356 bn
+1.789 bn
5.67%
1 ene 2010 año
31.83 bn
-1.526 bn
-4.58%
1 ene 2011 año
34.759 bn
+2.929 bn
9.2%
1 ene 2012 año
40.21 bn
+5.45 bn
15.68%
1 ene 2013 año
42.772 bn
+2.562 bn
6.37%
1 ene 2014 año
46.228 bn
+3.456 bn
8.08%

Ranking de los países por los datos estadísticos actuales