33
/es/
AIzaSyAYiBZKx7MnpbEhh9jyipgxe19OcubqV5w
August 1, 2025
194983
Mauritius
MUS
true
2
1
Tax revenue (current LCU)
2015,2014,2013,2012,2011,2010,2009,2008,2007,2006,2005,2004,2003,2002,2001,2000,1999,1998,1997,1996,1995,1994,1993,1992,1991
Download
Estadísticas Globales de la Biblioteca →Mauritius →

Tax revenue (current LCU)

Estas estadísticas en otros países:

AfghanistanAlbaniaAlgeriaAngolaAntigua and BarbudaArgentinaArmeniaAustraliaAustriaAzerbaijanBahamas, TheBahrainBangladeshBarbadosBelarusBelgiumBelizeBeninBhutanBoliviaBosnia and HerzegovinaBotswanaBrazilBulgariaBurkina FasoBurundiCabo VerdeCambodiaCanadaCentral African RepublicChileChinaColombiaCongo, Dem. Rep.Congo, Rep.Costa RicaCote d'IvoireCroatiaCyprusCzech RepublicDenmarkDominicaDominican RepublicEgypt, Arab Rep.El SalvadorEquatorial GuineaEstoniaEthiopiaFijiFinlandFranceGambia, TheGeorgiaGermanyGhanaGreeceGrenadaGuatemalaHondurasHong Kong SAR, ChinaHungaryIcelandIndiaIndonesiaIran, Islamic Rep.IraqIrelandIsraelItalyJamaicaJapanJordanKazakhstanKenyaKiribatiKorea, Rep.KuwaitKyrgyz RepublicLao PDRLatviaLebanonLesothoLiberiaLithuaniaLuxembourgMacao SAR, ChinaMacedonia, FYRMadagascarMalawiMalaysiaMaldivesMaliMaltaMauritiusMexicoMicronesia, Fed. Sts.MoldovaMongoliaMoroccoMozambiqueMyanmarNamibiaNepalNetherlandsNew ZealandNicaraguaNigeriaNorwayOmanPakistanPanamaPapua New GuineaParaguayPeruPhilippinesPolandPortugalQatarRomaniaRussian FederationRwandaSamoaSan MarinoSao Tome and PrincipeSenegalSerbiaSeychellesSierra LeoneSingaporeSlovak RepublicSloveniaSolomon IslandsSouth AfricaSpainSri LankaSt. Kitts and NevisSt. LuciaSt. Vincent and the GrenadinesSurinameSwazilandSwedenSwitzerlandSyrian Arab RepublicTajikistanTanzaniaThailandTimor-LesteTogoTrinidad and TobagoTunisiaTurkeyUgandaUkraineUnited Arab EmiratesUnited KingdomUnited StatesUruguayVanuatuVenezuela, RBVietnamWest Bank and GazaYemen, Rep.ZambiaZimbabwe

línea de tiempo (timeline):

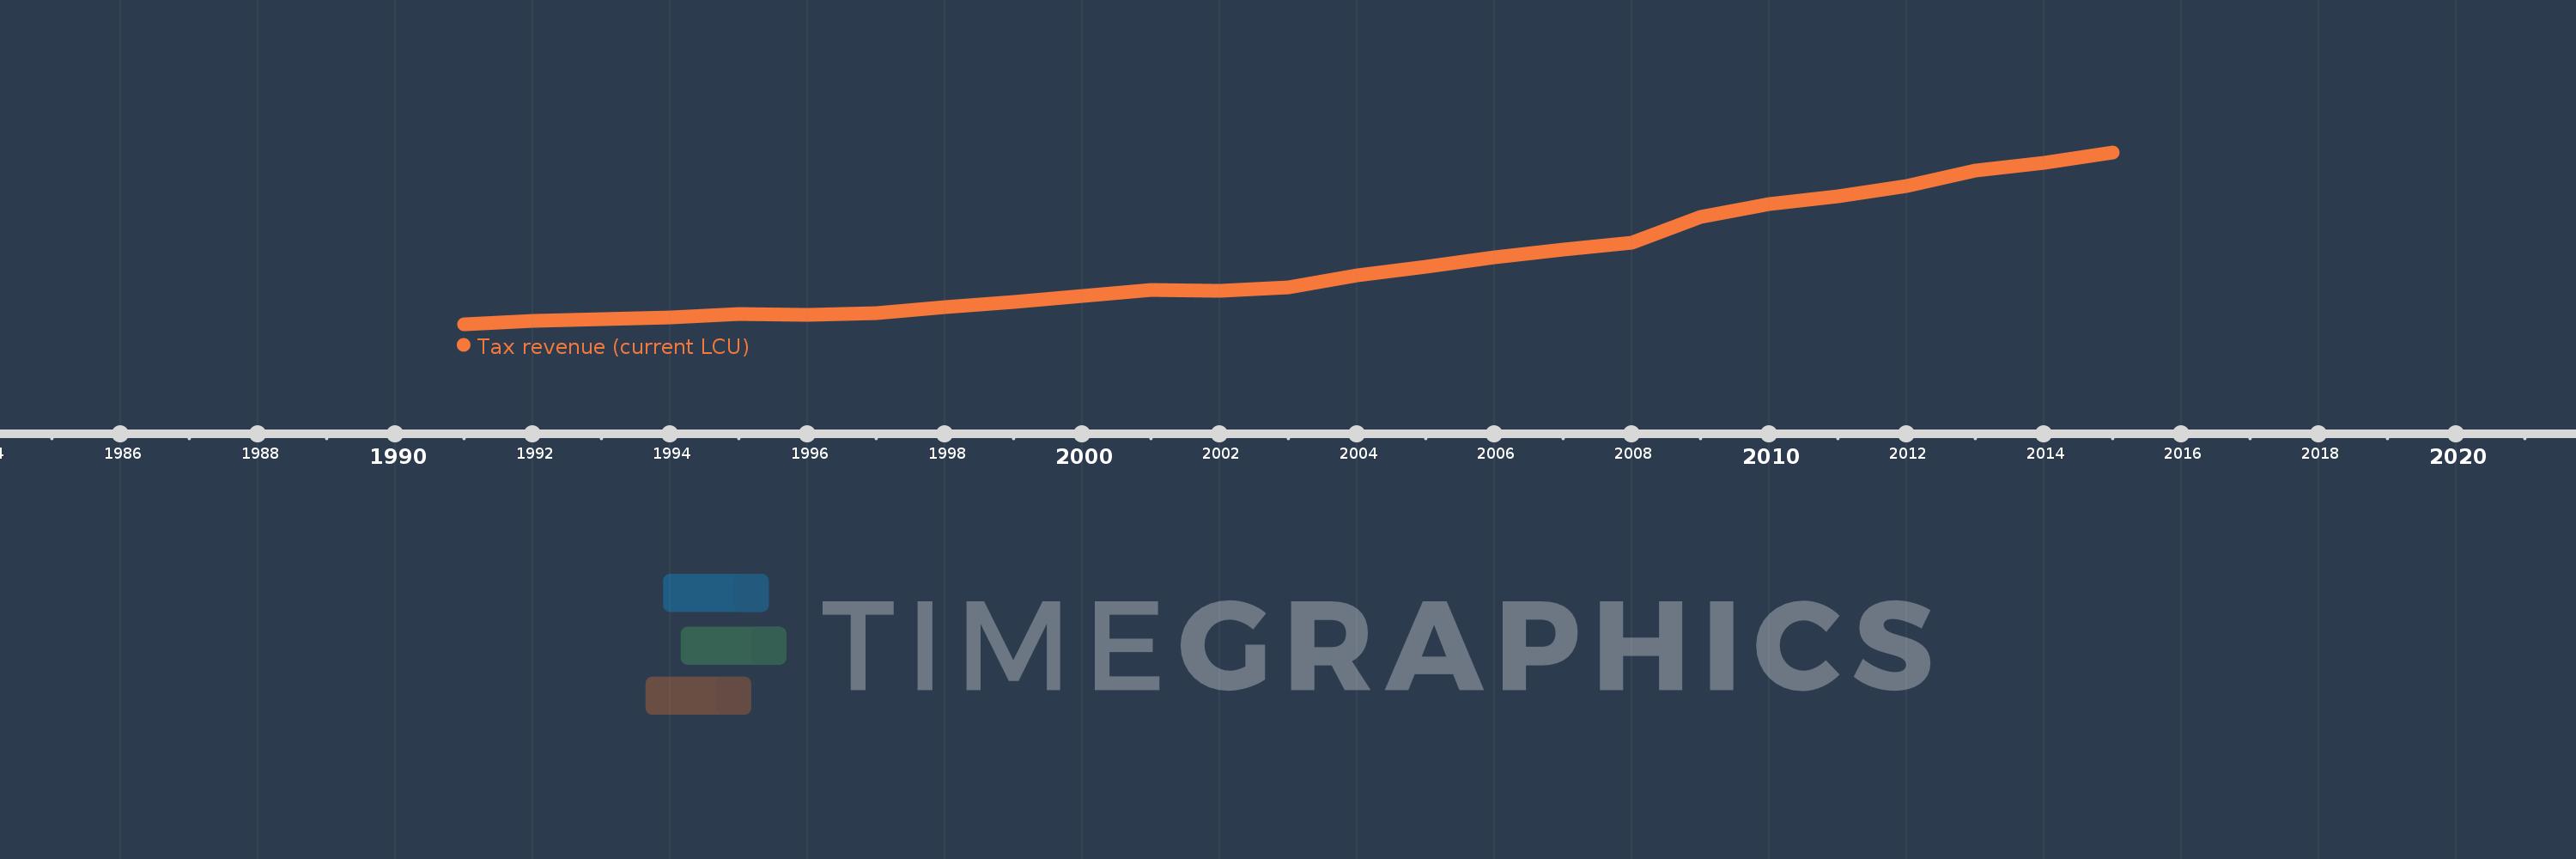
En esta escala de tiempo se presenta un gráfico de 1991 y 2015 de Mauritius. Los datos de 1990 están ausentes. El número de observaciones reales por fecha: 25.

Fuente (nombre):

Indicadores del desarrollo mundial

Fuente (organización):

International Monetary Fund, Government Finance Statistics Yearbook and data files.

Categorías:

Public Sector

Se ha actualizado:

23 abr 2017 año

Los indicadores de los cambios de valor en los últimos años

En promedio:
30.479 bn
Mínimo:
7.685 bn
1 ene 1991 año
Máximo:
71.727 bn
1 ene 2015 año
A la fecha de observación
Valor
Cambio absoluto
El cambio con respecto al valor anterior
1 ene 1991 año
7.685 bn
+7.685 bn
0.0%
1 ene 1992 año
9.026 bn
+1.341 bn
17.45%
1 ene 1993 año
9.552 bn
+526.4 millones
5.83%
1 ene 1994 año
10.36 bn
+808.1 millones
8.46%
1 ene 1995 año
11.612 bn
+1.251 bn
12.08%
1 ene 1996 año
11.242 bn
-369.1 millones
-3.18%
1 ene 1997 año
11.662 bn
+420.0 millones
3.74%
1 ene 1998 año
14.001 bn
+2.338 bn
20.05%
1 ene 1999 año
15.886 bn
+1.885 bn
13.46%
1 ene 2000 año
18.2 bn
+2.314 bn
14.57%
1 ene 2001 año
20.613 bn
+2.413 bn
13.26%
1 ene 2002 año
20.189 bn
-423.5 millones
-2.05%
1 ene 2003 año
21.519 bn
+1.33 bn
6.59%
1 ene 2004 año
25.879 bn
+4.36 bn
20.26%
1 ene 2005 año
29.068 bn
+3.189 bn
12.32%
1 ene 2006 año
32.719 bn
+3.651 bn
12.56%
1 ene 2007 año
35.382 bn
+2.663 bn
8.14%
1 ene 2008 año
38.186 bn
+2.804 bn
7.93%
1 ene 2009 año
47.831 bn
+9.646 bn
25.26%
1 ene 2010 año
52.333 bn
+4.501 bn
9.41%
1 ene 2011 año
55.209 bn
+2.877 bn
5.5%
1 ene 2012 año
59.18 bn
+3.971 bn
7.19%
1 ene 2013 año
64.919 bn
+5.739 bn
9.7%
1 ene 2014 año
67.991 bn
+3.072 bn
4.73%
1 ene 2015 año
71.727 bn
+3.737 bn
5.5%

Ranking de los países por los datos estadísticos actuales