33
/es/
AIzaSyAYiBZKx7MnpbEhh9jyipgxe19OcubqV5w
August 1, 2025
111677
Congo, Rep.
COG
true
2
1
Tax revenue (current LCU)
2013,2012,2011,2010,2009,2008,2007,2006,2005,2004,2003,2002,2000,1999,1998,1997,1996,1995,1994,1993,1981,1976,1975,1974,1973
Download
Estadísticas Globales de la Biblioteca →Congo, Rep. →

Tax revenue (current LCU)

Estas estadísticas en otros países:

AfghanistanAlbaniaAlgeriaAngolaAntigua and BarbudaArgentinaArmeniaAustraliaAustriaAzerbaijanBahamas, TheBahrainBangladeshBarbadosBelarusBelgiumBelizeBeninBhutanBoliviaBosnia and HerzegovinaBotswanaBrazilBulgariaBurkina FasoBurundiCabo VerdeCambodiaCanadaCentral African RepublicChileChinaColombiaCongo, Dem. Rep.Congo, Rep.Costa RicaCote d'IvoireCroatiaCyprusCzech RepublicDenmarkDominicaDominican RepublicEgypt, Arab Rep.El SalvadorEquatorial GuineaEstoniaEthiopiaFijiFinlandFranceGambia, TheGeorgiaGermanyGhanaGreeceGrenadaGuatemalaHondurasHong Kong SAR, ChinaHungaryIcelandIndiaIndonesiaIran, Islamic Rep.IraqIrelandIsraelItalyJamaicaJapanJordanKazakhstanKenyaKiribatiKorea, Rep.KuwaitKyrgyz RepublicLao PDRLatviaLebanonLesothoLiberiaLithuaniaLuxembourgMacao SAR, ChinaMacedonia, FYRMadagascarMalawiMalaysiaMaldivesMaliMaltaMauritiusMexicoMicronesia, Fed. Sts.MoldovaMongoliaMoroccoMozambiqueMyanmarNamibiaNepalNetherlandsNew ZealandNicaraguaNigeriaNorwayOmanPakistanPanamaPapua New GuineaParaguayPeruPhilippinesPolandPortugalQatarRomaniaRussian FederationRwandaSamoaSan MarinoSao Tome and PrincipeSenegalSerbiaSeychellesSierra LeoneSingaporeSlovak RepublicSloveniaSolomon IslandsSouth AfricaSpainSri LankaSt. Kitts and NevisSt. LuciaSt. Vincent and the GrenadinesSurinameSwazilandSwedenSwitzerlandSyrian Arab RepublicTajikistanTanzaniaThailandTimor-LesteTogoTrinidad and TobagoTunisiaTurkeyUgandaUkraineUnited Arab EmiratesUnited KingdomUnited StatesUruguayVanuatuVenezuela, RBVietnamWest Bank and GazaYemen, Rep.ZambiaZimbabwe

línea de tiempo (timeline):

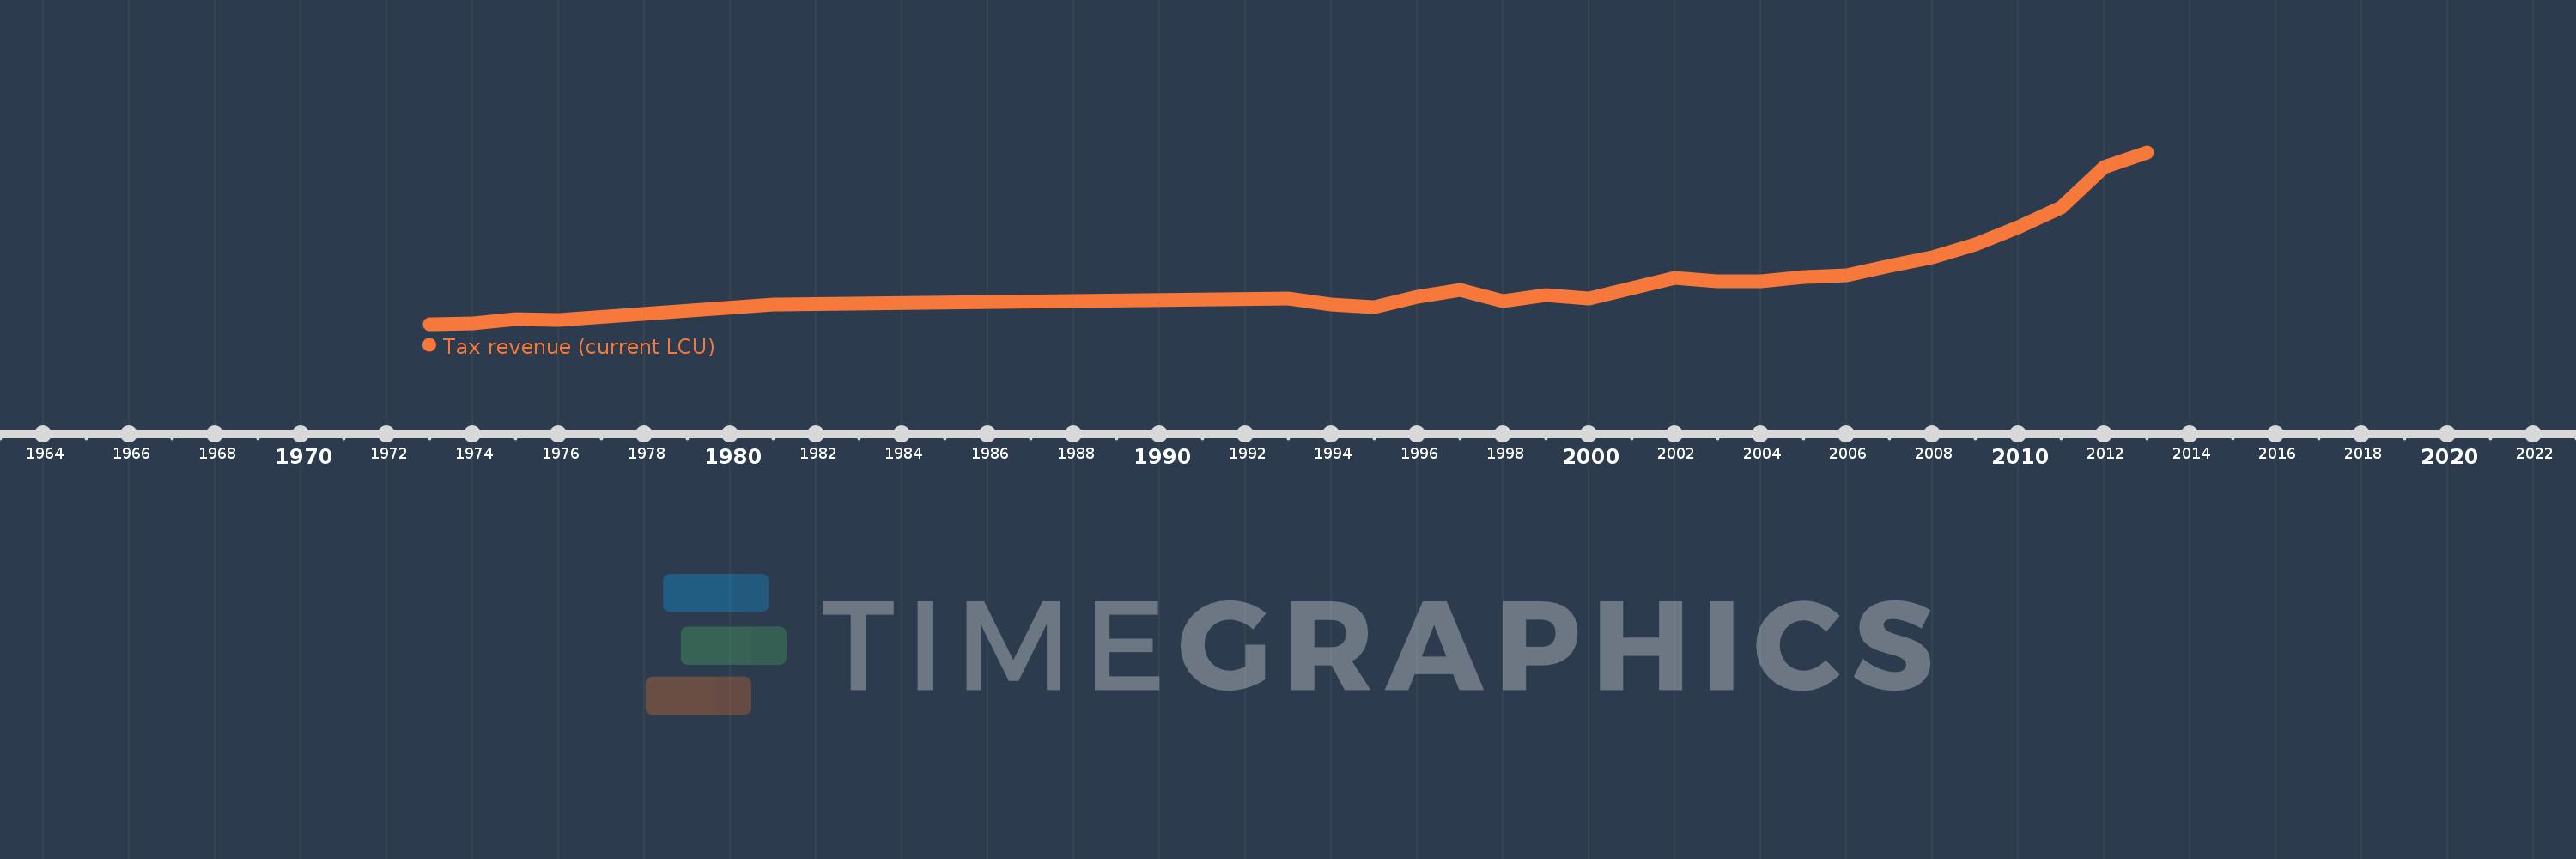
En esta escala de tiempo se presenta un gráfico de 1973 y 2013 de Congo, Rep.. Los datos de 1972 están ausentes. El número de observaciones reales por fecha: 25.

Fuente (nombre):

Indicadores del desarrollo mundial

Fuente (organización):

International Monetary Fund, Government Finance Statistics Yearbook and data files.

Categorías:

Public Sector

Se ha actualizado:

23 abr 2017 año

Los indicadores de los cambios de valor en los últimos años

En promedio:
197.189 bn
Mínimo:
17.38 bn
1 ene 1973 año
Máximo:
658.402 bn
1 ene 2013 año
A la fecha de observación
Valor
Cambio absoluto
El cambio con respecto al valor anterior
1 ene 1973 año
17.38 bn
+17.38 bn
0.0%
1 ene 1974 año
18.69 bn
+1.31 bn
7.54%
1 ene 1975 año
35.22 bn
+16.53 bn
88.44%
1 ene 1976 año
33.5 bn
-1.72 bn
-4.88%
1 ene 1981 año
91.65 bn
+58.15 bn
173.58%
1 ene 1993 año
114.1 bn
+22.45 bn
24.5%
1 ene 1994 año
89.2 bn
-24.9 bn
-21.82%
1 ene 1995 año
81.3 bn
-7.9 bn
-8.86%
1 ene 1996 año
118.75 bn
+37.45 bn
46.06%
1 ene 1997 año
144.67 bn
+25.92 bn
21.83%
1 ene 1998 año
103.28 bn
-41.39 bn
-28.61%
1 ene 1999 año
125.39 bn
+22.11 bn
21.41%
1 ene 2000 año
112.63 bn
-12.76 bn
-10.18%
1 ene 2002 año
188.764 bn
+76.134 bn
67.6%
1 ene 2003 año
176.0 bn
-12.764 bn
-6.76%
1 ene 2004 año
176.823 bn
+822.816 millones
0.47%
1 ene 2005 año
192.762 bn
+15.939 bn
9.01%
1 ene 2006 año
200.448 bn
+7.686 bn
3.99%
1 ene 2007 año
234.1 bn
+33.652 bn
16.79%
1 ene 2008 año
265.642 bn
+31.542 bn
13.47%
1 ene 2009 año
315.77 bn
+50.128 bn
18.87%
1 ene 2010 año
380.739 bn
+64.969 bn
20.57%
1 ene 2011 año
451.75 bn
+71.011 bn
18.65%
1 ene 2012 año
602.771 bn
+151.021 bn
33.43%
1 ene 2013 año
658.402 bn
+55.631 bn
9.23%

Ranking de los países por los datos estadísticos actuales