33
/es/
AIzaSyAYiBZKx7MnpbEhh9jyipgxe19OcubqV5w
August 1, 2025
224362
Philippines
PHL
true
2
1
Tax revenue (current LCU)
2015,2014,2013,2012,2011,2010,2009,2008,2007,2006,2005,2004,2003,2002,2001,2000,1999,1998,1997,1996,1995,1994,1993,1992,1991
Download
Estadísticas Globales de la Biblioteca →Philippines →

Tax revenue (current LCU)

Estas estadísticas en otros países:

AfghanistanAlbaniaAlgeriaAngolaAntigua and BarbudaArgentinaArmeniaAustraliaAustriaAzerbaijanBahamas, TheBahrainBangladeshBarbadosBelarusBelgiumBelizeBeninBhutanBoliviaBosnia and HerzegovinaBotswanaBrazilBulgariaBurkina FasoBurundiCabo VerdeCambodiaCanadaCentral African RepublicChileChinaColombiaCongo, Dem. Rep.Congo, Rep.Costa RicaCote d'IvoireCroatiaCyprusCzech RepublicDenmarkDominicaDominican RepublicEgypt, Arab Rep.El SalvadorEquatorial GuineaEstoniaEthiopiaFijiFinlandFranceGambia, TheGeorgiaGermanyGhanaGreeceGrenadaGuatemalaHondurasHong Kong SAR, ChinaHungaryIcelandIndiaIndonesiaIran, Islamic Rep.IraqIrelandIsraelItalyJamaicaJapanJordanKazakhstanKenyaKiribatiKorea, Rep.KuwaitKyrgyz RepublicLao PDRLatviaLebanonLesothoLiberiaLithuaniaLuxembourgMacao SAR, ChinaMacedonia, FYRMadagascarMalawiMalaysiaMaldivesMaliMaltaMauritiusMexicoMicronesia, Fed. Sts.MoldovaMongoliaMoroccoMozambiqueMyanmarNamibiaNepalNetherlandsNew ZealandNicaraguaNigeriaNorwayOmanPakistanPanamaPapua New GuineaParaguayPeruPhilippinesPolandPortugalQatarRomaniaRussian FederationRwandaSamoaSan MarinoSao Tome and PrincipeSenegalSerbiaSeychellesSierra LeoneSingaporeSlovak RepublicSloveniaSolomon IslandsSouth AfricaSpainSri LankaSt. Kitts and NevisSt. LuciaSt. Vincent and the GrenadinesSurinameSwazilandSwedenSwitzerlandSyrian Arab RepublicTajikistanTanzaniaThailandTimor-LesteTogoTrinidad and TobagoTunisiaTurkeyUgandaUkraineUnited Arab EmiratesUnited KingdomUnited StatesUruguayVanuatuVenezuela, RBVietnamWest Bank and GazaYemen, Rep.ZambiaZimbabwe

línea de tiempo (timeline):

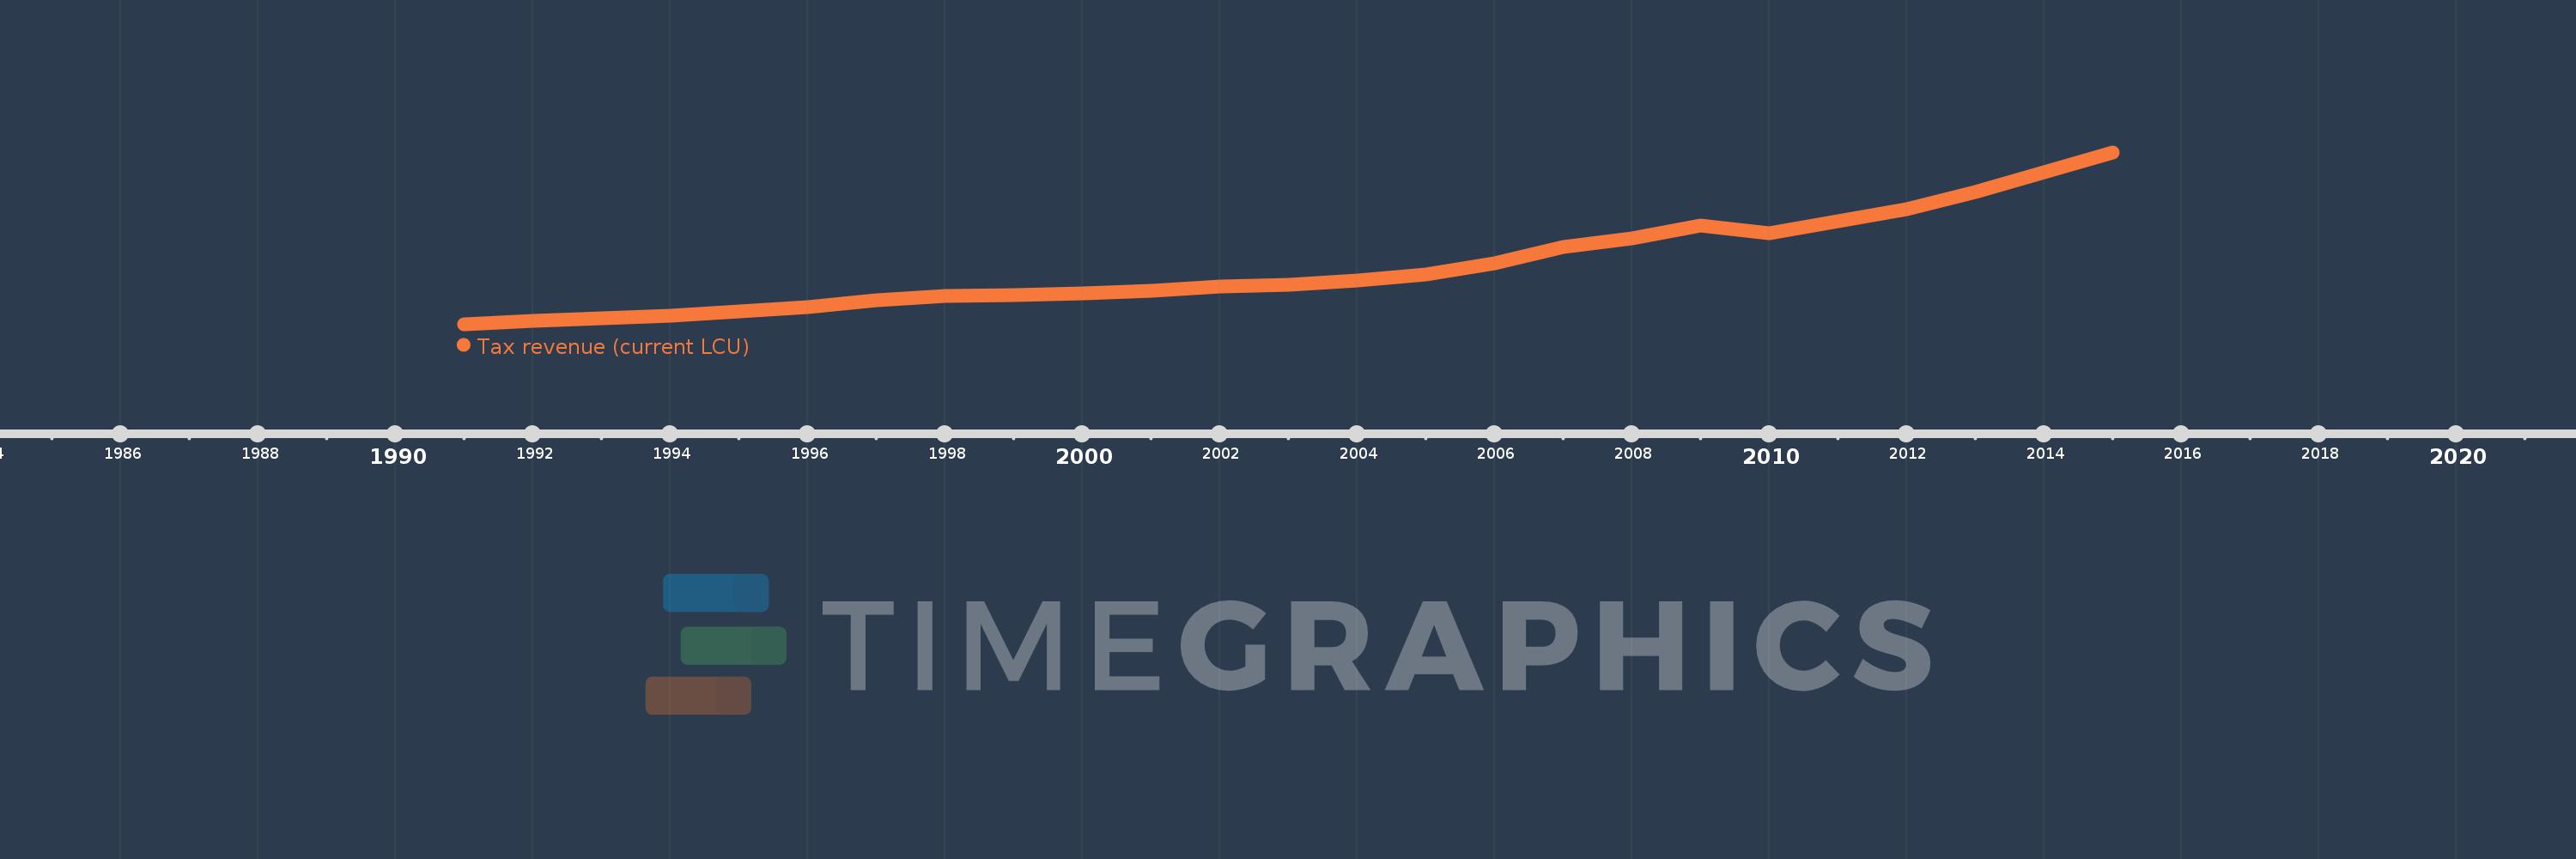
En esta escala de tiempo se presenta un gráfico de 1991 y 2015 de Philippines. Los datos de 1990 están ausentes. El número de observaciones reales por fecha: 25.

Fuente (nombre):

Indicadores del desarrollo mundial

Fuente (organización):

International Monetary Fund, Government Finance Statistics Yearbook and data files.

Categorías:

Public Sector

Se ha actualizado:

23 abr 2017 año

Los indicadores de los cambios de valor en los últimos años

En promedio:
681.613 bn
Mínimo:
151.7 bn
1 ene 1991 año
Máximo:
1.719 billones
1 ene 2015 año
A la fecha de observación
Valor
Cambio absoluto
El cambio con respecto al valor anterior
1 ene 1991 año
151.7 bn
+151.7 bn
0.0%
1 ene 1992 año
182.275 bn
+30.575 bn
20.15%
1 ene 1993 año
208.705 bn
+26.43 bn
14.5%
1 ene 1994 año
230.17 bn
+21.465 bn
10.28%
1 ene 1995 año
271.305 bn
+41.135 bn
17.87%
1 ene 1996 año
310.517 bn
+39.212 bn
14.45%
1 ene 1997 año
367.894 bn
+57.377 bn
18.48%
1 ene 1998 año
412.165 bn
+44.271 bn
12.03%
1 ene 1999 año
416.585 bn
+4.42 bn
1.07%
1 ene 2000 año
431.686 bn
+15.101 bn
3.62%
1 ene 2001 año
459.988 bn
+28.302 bn
6.56%
1 ene 2002 año
493.613 bn
+33.625 bn
7.31%
1 ene 2003 año
507.629 bn
+14.016 bn
2.84%
1 ene 2004 año
550.4 bn
+42.771 bn
8.43%
1 ene 2005 año
605.03 bn
+54.63 bn
9.93%
1 ene 2006 año
705.59 bn
+100.56 bn
16.62%
1 ene 2007 año
859.893 bn
+154.303 bn
21.87%
1 ene 2008 año
932.922 bn
+73.029 bn
8.49%
1 ene 2009 año
1.049 billones
+116.302 bn
12.47%
1 ene 2010 año
981.59 bn
-67.634 bn
-6.45%
1 ene 2011 año
1.094 billones
+112.062 bn
11.42%
1 ene 2012 año
1.202 billones
+108.389 bn
9.91%
1 ene 2013 año
1.361 billones
+159.067 bn
13.23%
1 ene 2014 año
1.536 billones
+174.598 bn
12.83%
1 ene 2015 año
1.719 billones
+183.231 bn
11.93%

Ranking de los países por los datos estadísticos actuales