33
/es/
AIzaSyAYiBZKx7MnpbEhh9jyipgxe19OcubqV5w
August 1, 2025
249413
Sri Lanka
LKA
true
2
1
Revenue, excluding grants (current LCU)
2015,2014,2013,2012,2011,2010,2009,2008,2007,2006,2005,2004,2003,2002,2001,2000,1999,1998,1997,1996,1995,1994,1993,1992,1991
Download
Estadísticas Globales de la Biblioteca →Sri Lanka →

Revenue, excluding grants (current LCU)

Estas estadísticas en otros países:

AfghanistanAlbaniaAlgeriaAngolaAntigua and BarbudaArgentinaArmeniaAustraliaAustriaAzerbaijanBahamas, TheBahrainBangladeshBarbadosBelarusBelgiumBelizeBeninBhutanBoliviaBosnia and HerzegovinaBotswanaBrazilBulgariaBurkina FasoBurundiCabo VerdeCambodiaCanadaCentral African RepublicChileChinaColombiaCongo, Dem. Rep.Congo, Rep.Costa RicaCote d'IvoireCroatiaCyprusCzech RepublicDenmarkDominicaDominican RepublicEgypt, Arab Rep.El SalvadorEquatorial GuineaEstoniaEthiopiaFijiFinlandFranceGambia, TheGeorgiaGermanyGhanaGreeceGrenadaGuatemalaHondurasHong Kong SAR, ChinaHungaryIcelandIndiaIndonesiaIran, Islamic Rep.IraqIrelandIsraelItalyJamaicaJapanJordanKazakhstanKenyaKiribatiKorea, Rep.KuwaitKyrgyz RepublicLao PDRLatviaLebanonLesothoLiberiaLithuaniaLuxembourgMacao SAR, ChinaMacedonia, FYRMadagascarMalawiMalaysiaMaldivesMaliMaltaMauritiusMexicoMicronesia, Fed. Sts.MoldovaMongoliaMoroccoMozambiqueMyanmarNamibiaNepalNetherlandsNew ZealandNicaraguaNigeriaNorwayOmanPakistanPanamaPapua New GuineaParaguayPeruPhilippinesPolandPortugalQatarRomaniaRussian FederationRwandaSamoaSan MarinoSao Tome and PrincipeSenegalSerbiaSeychellesSierra LeoneSingaporeSlovak RepublicSloveniaSolomon IslandsSouth AfricaSpainSri LankaSt. Kitts and NevisSt. LuciaSt. Vincent and the GrenadinesSurinameSwazilandSwedenSwitzerlandSyrian Arab RepublicTajikistanTanzaniaThailandTimor-LesteTogoTrinidad and TobagoTunisiaTurkeyUgandaUkraineUnited Arab EmiratesUnited KingdomUnited StatesUruguayVanuatuVenezuela, RBVietnamWest Bank and GazaYemen, Rep.ZambiaZimbabwe

línea de tiempo (timeline):

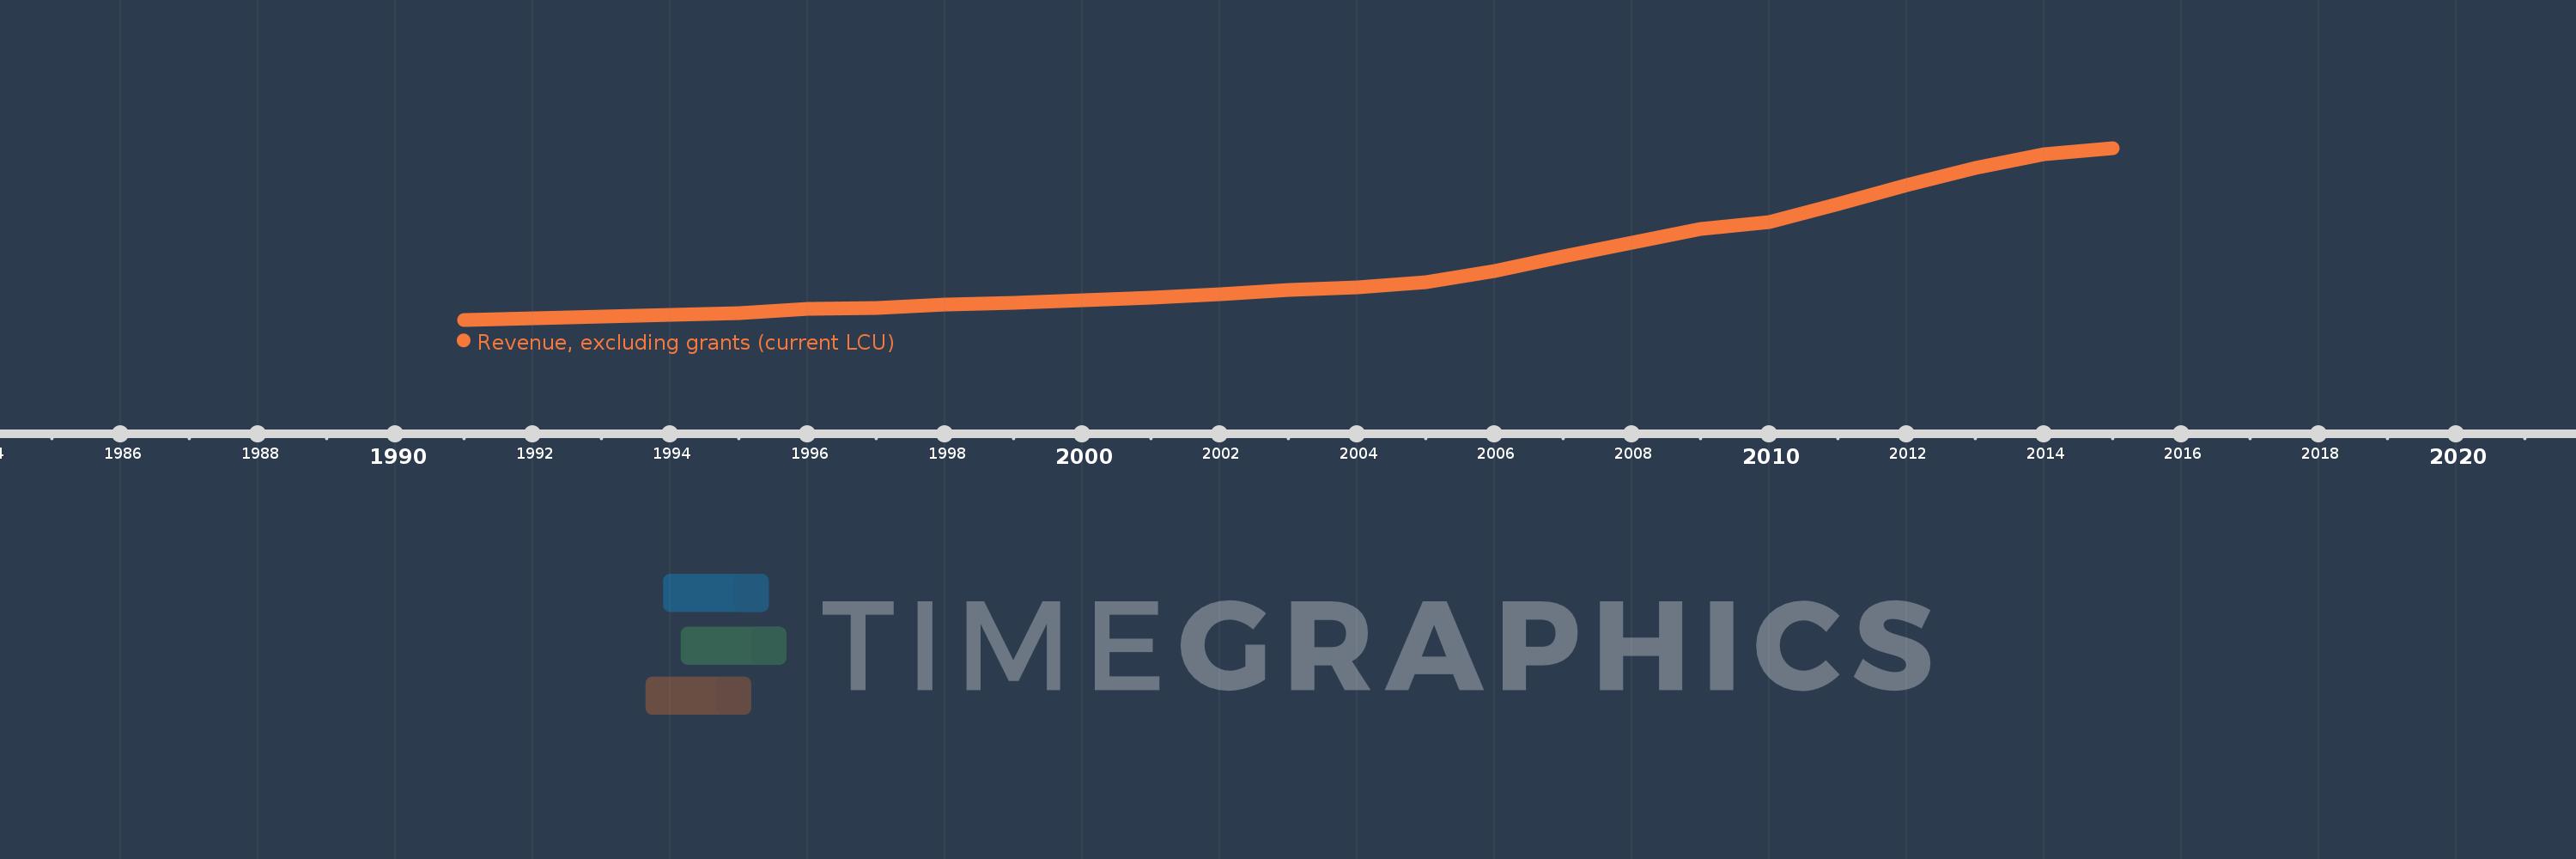
En esta escala de tiempo se presenta un gráfico de 1991 y 2015 de Sri Lanka. Los datos de 1990 están ausentes. El número de observaciones reales por fecha: 25.

Fuente (nombre):

Indicadores del desarrollo mundial

Fuente (organización):

International Monetary Fund, Government Finance Statistics Yearbook and data files.

Categorías:

Public Sector

Se ha actualizado:

23 abr 2017 año

Los indicadores de los cambios de valor en los últimos años

En promedio:
417.718 bn
Mínimo:
67.635 bn
1 ene 1991 año
Máximo:
1.178 billones
1 ene 2015 año
A la fecha de observación
Valor
Cambio absoluto
El cambio con respecto al valor anterior
1 ene 1991 año
67.635 bn
+67.635 bn
0.0%
1 ene 1992 año
76.427 bn
+8.792 bn
13.0%
1 ene 1993 año
85.77 bn
+9.343 bn
12.22%
1 ene 1994 año
98.423 bn
+12.653 bn
14.75%
1 ene 1995 año
110.038 bn
+11.615 bn
11.8%
1 ene 1996 año
136.161 bn
+26.123 bn
23.74%
1 ene 1997 año
146.245 bn
+10.084 bn
7.41%
1 ene 1998 año
164.779 bn
+18.534 bn
12.67%
1 ene 1999 año
174.965 bn
+10.186 bn
6.18%
1 ene 2000 año
195.895 bn
+20.93 bn
11.96%
1 ene 2001 año
211.244 bn
+15.349 bn
7.84%
1 ene 2002 año
234.189 bn
+22.945 bn
10.86%
1 ene 2003 año
259.919 bn
+25.73 bn
10.99%
1 ene 2004 año
276.26 bn
+16.341 bn
6.29%
1 ene 2005 año
311.366 bn
+35.106 bn
12.71%
1 ene 2006 año
379.667 bn
+68.301 bn
21.94%
1 ene 2007 año
476.82 bn
+97.153 bn
25.59%
1 ene 2008 año
564.506 bn
+87.686 bn
18.39%
1 ene 2009 año
655.259 bn
+90.753 bn
16.08%
1 ene 2010 año
699.644 bn
+44.385 bn
6.77%
1 ene 2011 año
817.279 bn
+117.635 bn
16.81%
1 ene 2012 año
934.776 bn
+117.497 bn
14.38%
1 ene 2013 año
1.051 billones
+115.853 bn
12.39%
1 ene 2014 año
1.137 billones
+86.822 bn
8.26%
1 ene 2015 año
1.178 billones
+40.15 bn
3.53%

Ranking de los países por los datos estadísticos actuales