29
/es/
es
AIzaSyAYiBZKx7MnpbEhh9jyipgxe19OcubqV5w
April 1, 2024
207402
Nepal
NPL
true
2
1
Revenue, excluding grants (current LCU)
2016,2015,2014,2013,2012,2011,2010,2009,2008,2007,2006,2005,2004,2003,2002,2001,2000,1999,1998,1997,1996,1995,1994,1993,1992,1991
Download
Estadísticas Globales de la Biblioteca →Nepal →

Revenue, excluding grants (current LCU)

Estas estadísticas en otros países:
AfghanistanAlbaniaAlgeriaAngolaAntigua and BarbudaArgentinaArmeniaAustraliaAustriaAzerbaijanBahamas, TheBahrainBangladeshBarbadosBelarusBelgiumBelizeBeninBhutanBoliviaBosnia and HerzegovinaBotswanaBrazilBulgariaBurkina FasoBurundiCabo VerdeCambodiaCanadaCentral African RepublicChileChinaColombiaCongo, Dem. Rep.Congo, Rep.Costa RicaCote d'IvoireCroatiaCyprusCzech RepublicDenmarkDominicaDominican RepublicEgypt, Arab Rep.El SalvadorEquatorial GuineaEstoniaEthiopiaFijiFinlandFranceGambia, TheGeorgiaGermanyGhanaGreeceGrenadaGuatemalaHondurasHong Kong SAR, ChinaHungaryIcelandIndiaIndonesiaIran, Islamic Rep.IraqIrelandIsraelItalyJamaicaJapanJordanKazakhstanKenyaKiribatiKorea, Rep.KuwaitKyrgyz RepublicLao PDRLatviaLebanonLesothoLiberiaLithuaniaLuxembourgMacao SAR, ChinaMacedonia, FYRMadagascarMalawiMalaysiaMaldivesMaliMaltaMauritiusMexicoMicronesia, Fed. Sts.MoldovaMongoliaMoroccoMozambiqueMyanmarNamibiaNepalNetherlandsNew ZealandNicaraguaNigeriaNorwayOmanPakistanPanamaPapua New GuineaParaguayPeruPhilippinesPolandPortugalQatarRomaniaRussian FederationRwandaSamoaSan MarinoSao Tome and PrincipeSenegalSerbiaSeychellesSierra LeoneSingaporeSlovak RepublicSloveniaSolomon IslandsSouth AfricaSpainSri LankaSt. Kitts and NevisSt. LuciaSt. Vincent and the GrenadinesSurinameSwazilandSwedenSwitzerlandSyrian Arab RepublicTajikistanTanzaniaThailandTimor-LesteTogoTrinidad and TobagoTunisiaTurkeyUgandaUkraineUnited Arab EmiratesUnited KingdomUnited StatesUruguayVanuatuVenezuela, RBVietnamWest Bank and GazaYemen, Rep.ZambiaZimbabwe
línea de tiempo (timeline):
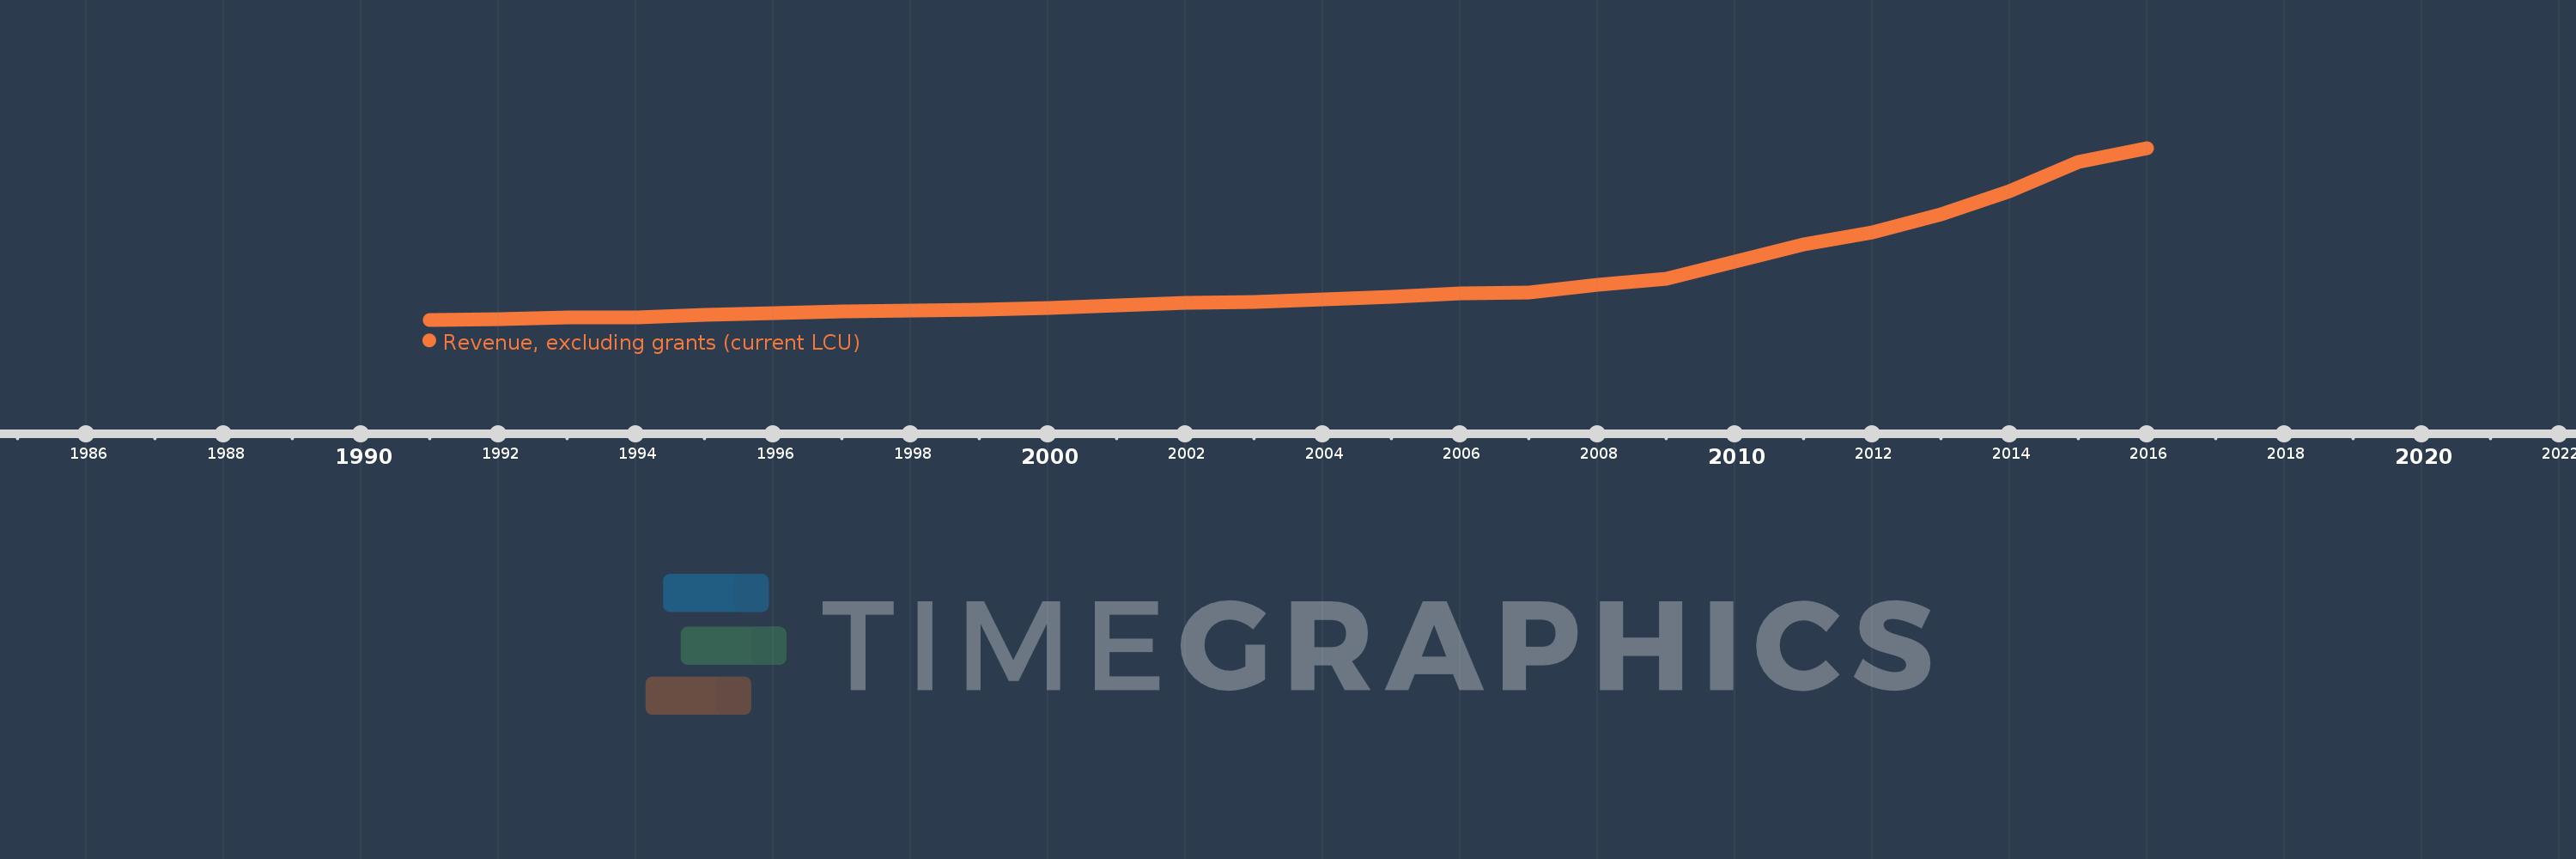
En esta escala de tiempo se presenta un gráfico de 1991 y 2016 de Nepal. Los datos de 1990 están ausentes. El número de observaciones reales por fecha: 26.
Fuente (nombre):
Indicadores del desarrollo mundial
Fuente (organización):
International Monetary Fund, Government Finance Statistics Yearbook and data files.
Categorías:
Public Sector
Se ha actualizado:
23 abr 2017 año
Los indicadores de los cambios de valor en los últimos años
En promedio:
99.999 bn
Mínimo:
8.734 bn
1 ene 1991 año
Máximo:
393.116 bn
1 ene 2016 año
A la fecha de observación
Valor
Cambio absoluto
El cambio con respecto al valor anterior
1 ene 1991 año
8.734 bn
+8.734 bn
0.0%
1 ene 1992 año
10.41 bn
+1.676 bn
19.19%
1 ene 1993 año
12.997 bn
+2.587 bn
24.85%
1 ene 1994 año
14.303 bn
+1.306 bn
10.05%
1 ene 1995 año
18.829 bn
+4.526 bn
31.64%
1 ene 1996 año
23.106 bn
+4.277 bn
22.71%
1 ene 1997 año
26.601 bn
+3.495 bn
15.13%
1 ene 1998 año
29.293 bn
+2.692 bn
10.12%
1 ene 1999 año
31.371 bn
+2.078 bn
7.09%
1 ene 2000 año
34.713 bn
+3.342 bn
10.65%
1 ene 2001 año
40.303 bn
+5.59 bn
16.1%
1 ene 2002 año
46.146 bn
+5.843 bn
14.5%
1 ene 2003 año
48.255 bn
+2.109 bn
4.57%
1 ene 2004 año
53.679 bn
+5.424 bn
11.24%
1 ene 2005 año
59.781 bn
+6.102 bn
11.37%
1 ene 2006 año
68.065 bn
+8.284 bn
13.86%
1 ene 2007 año
70.273 bn
+2.208 bn
3.24%
1 ene 2008 año
86.387 bn
+16.114 bn
22.93%
1 ene 2009 año
100.329 bn
+13.942 bn
16.14%
1 ene 2010 año
139.641 bn
+39.312 bn
39.18%
1 ene 2011 año
177.704 bn
+38.062 bn
27.26%
1 ene 2012 año
203.583 bn
+25.879 bn
14.56%
1 ene 2013 año
244.255 bn
+40.672 bn
19.98%
1 ene 2014 año
295.686 bn
+51.431 bn
21.06%
1 ene 2015 año
362.426 bn
+66.739 bn
22.57%
1 ene 2016 año
393.116 bn
+30.69 bn
8.47%
Ranking de los países por los datos estadísticos actuales

Comentarios:

Enviar
PremiumAbout & FeedbackAcuerdoPrivacidad
logo
© 2022 Selected Technologies LLC – Morgan Hill, California