29
/es/
es
AIzaSyAYiBZKx7MnpbEhh9jyipgxe19OcubqV5w
April 1, 2024
115325
Croatia
HRV
true
2
1
Revenue, excluding grants (current LCU)
2015,2014,2013,2012,2011,2010,2009,2008,2007,2006,2005,2004,2003,2002,2001,2000,1999,1998,1997,1996,1995,1994,1993,1992
Download
Estadísticas Globales de la Biblioteca →Croatia →

Revenue, excluding grants (current LCU)

Estas estadísticas en otros países:
AfghanistanAlbaniaAlgeriaAngolaAntigua and BarbudaArgentinaArmeniaAustraliaAustriaAzerbaijanBahamas, TheBahrainBangladeshBarbadosBelarusBelgiumBelizeBeninBhutanBoliviaBosnia and HerzegovinaBotswanaBrazilBulgariaBurkina FasoBurundiCabo VerdeCambodiaCanadaCentral African RepublicChileChinaColombiaCongo, Dem. Rep.Congo, Rep.Costa RicaCote d'IvoireCroatiaCyprusCzech RepublicDenmarkDominicaDominican RepublicEgypt, Arab Rep.El SalvadorEquatorial GuineaEstoniaEthiopiaFijiFinlandFranceGambia, TheGeorgiaGermanyGhanaGreeceGrenadaGuatemalaHondurasHong Kong SAR, ChinaHungaryIcelandIndiaIndonesiaIran, Islamic Rep.IraqIrelandIsraelItalyJamaicaJapanJordanKazakhstanKenyaKiribatiKorea, Rep.KuwaitKyrgyz RepublicLao PDRLatviaLebanonLesothoLiberiaLithuaniaLuxembourgMacao SAR, ChinaMacedonia, FYRMadagascarMalawiMalaysiaMaldivesMaliMaltaMauritiusMexicoMicronesia, Fed. Sts.MoldovaMongoliaMoroccoMozambiqueMyanmarNamibiaNepalNetherlandsNew ZealandNicaraguaNigeriaNorwayOmanPakistanPanamaPapua New GuineaParaguayPeruPhilippinesPolandPortugalQatarRomaniaRussian FederationRwandaSamoaSan MarinoSao Tome and PrincipeSenegalSerbiaSeychellesSierra LeoneSingaporeSlovak RepublicSloveniaSolomon IslandsSouth AfricaSpainSri LankaSt. Kitts and NevisSt. LuciaSt. Vincent and the GrenadinesSurinameSwazilandSwedenSwitzerlandSyrian Arab RepublicTajikistanTanzaniaThailandTimor-LesteTogoTrinidad and TobagoTunisiaTurkeyUgandaUkraineUnited Arab EmiratesUnited KingdomUnited StatesUruguayVanuatuVenezuela, RBVietnamWest Bank and GazaYemen, Rep.ZambiaZimbabwe
línea de tiempo (timeline):
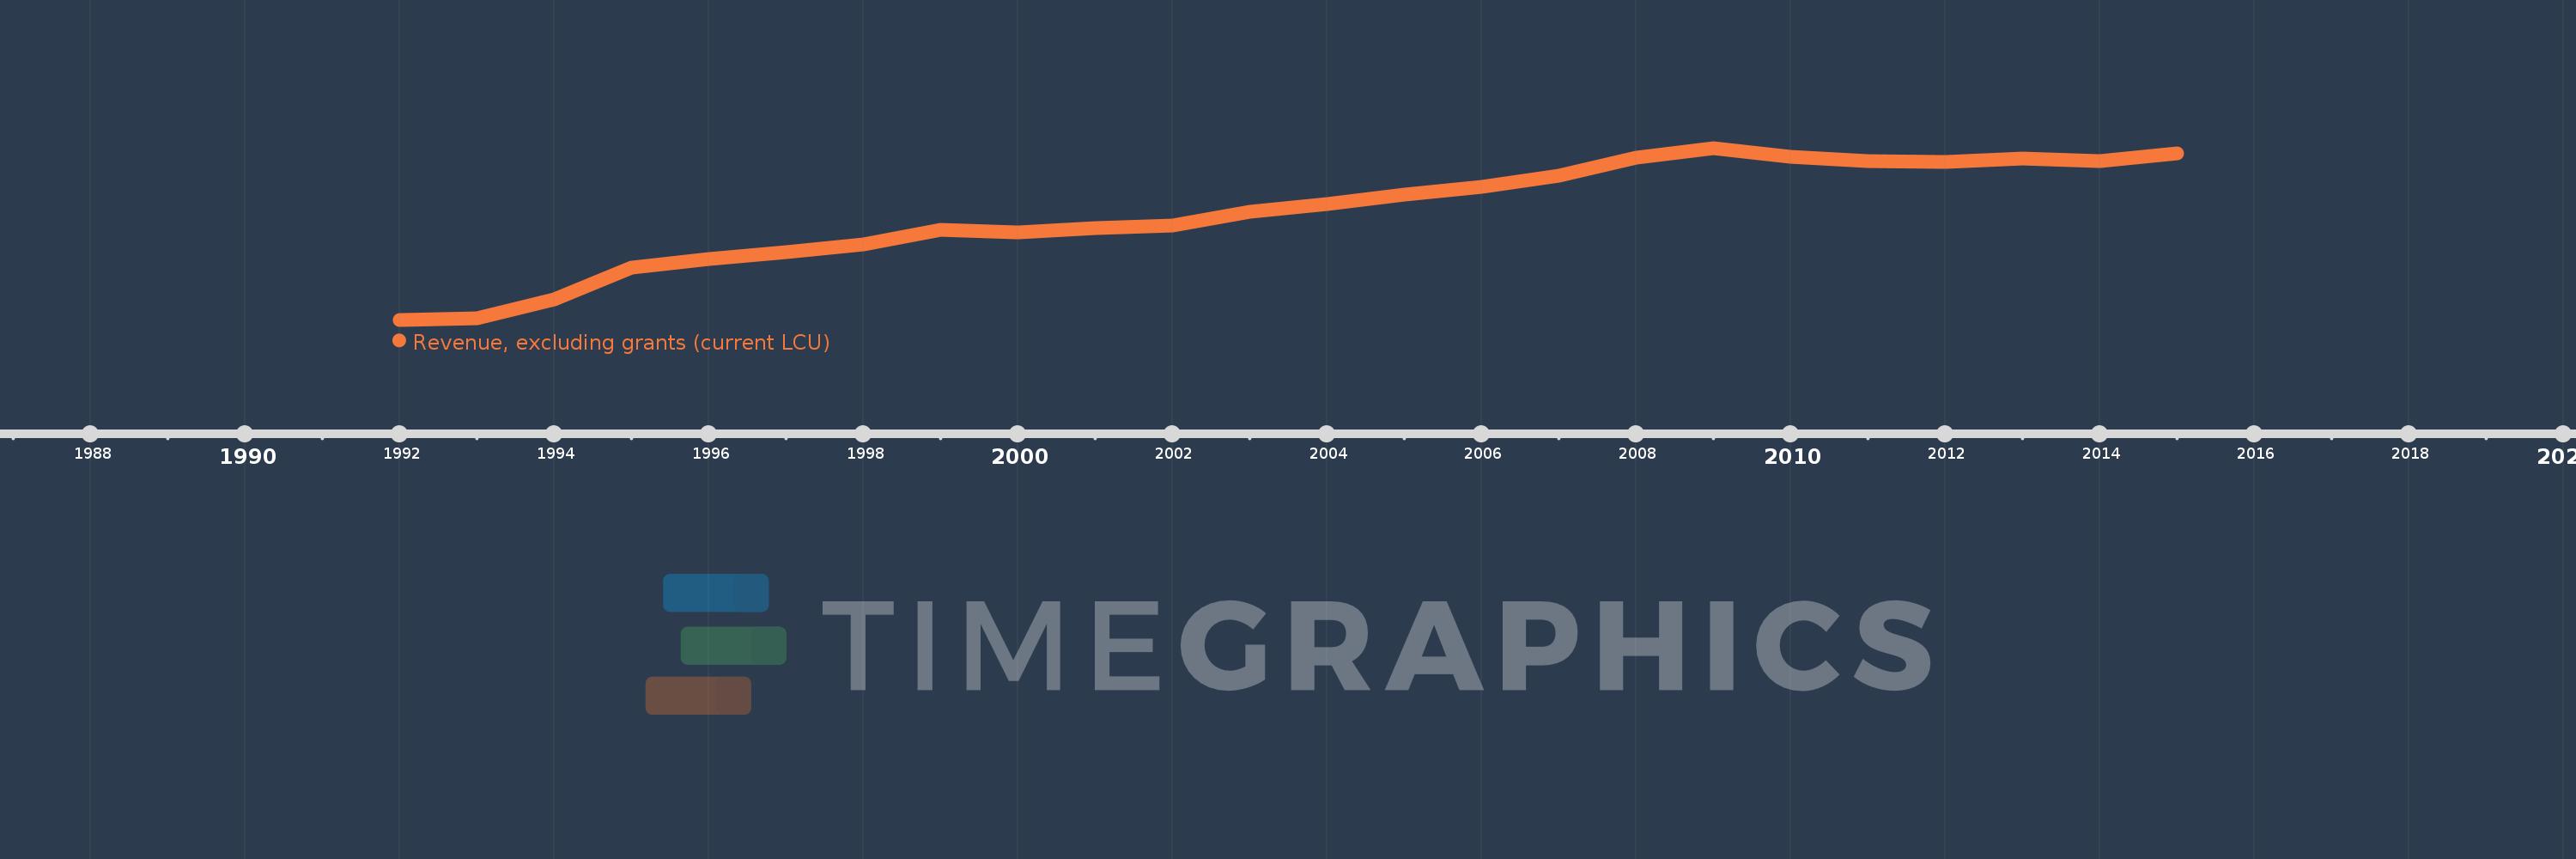
En esta escala de tiempo se presenta un gráfico de 1992 y 2015 de Croatia. Los datos de 1991 están ausentes. El número de observaciones reales por fecha: 24.
Fuente (nombre):
Indicadores del desarrollo mundial
Fuente (organización):
International Monetary Fund, Government Finance Statistics Yearbook and data files.
Categorías:
Public Sector
Se ha actualizado:
23 abr 2017 año
Los indicadores de los cambios de valor en los últimos años
En promedio:
74.419 bn
Mínimo:
145.6 millones
1 ene 1992 año
Máximo:
119.499 bn
1 ene 2009 año
A la fecha de observación
Valor
Cambio absoluto
El cambio con respecto al valor anterior
1 ene 1992 año
145.6 millones
+145.6 millones
0.0%
1 ene 1993 año
926.01 millones
+780.41 millones
536.0%
1 ene 1994 año
14.12 bn
+13.194 bn
1.42 mil%
1 ene 1995 año
36.528 bn
+22.408 bn
158.7%
1 ene 1996 año
42.427 bn
+5.899 bn
16.15%
1 ene 1997 año
47.126 bn
+4.699 bn
11.07%
1 ene 1998 año
52.623 bn
+5.496 bn
11.66%
1 ene 1999 año
62.813 bn
+10.19 bn
19.37%
1 ene 2000 año
61.122 bn
-1.691 bn
-2.69%
1 ene 2001 año
63.576 bn
+2.454 bn
4.02%
1 ene 2002 año
65.484 bn
+1.908 bn
3.0%
1 ene 2003 año
75.064 bn
+9.58 bn
14.63%
1 ene 2004 año
80.775 bn
+5.711 bn
7.61%
1 ene 2005 año
87.009 bn
+6.234 bn
7.72%
1 ene 2006 año
92.615 bn
+5.606 bn
6.44%
1 ene 2007 año
100.198 bn
+7.583 bn
8.19%
1 ene 2008 año
112.905 bn
+12.707 bn
12.68%
1 ene 2009 año
119.499 bn
+6.594 bn
5.84%
1 ene 2010 año
113.435 bn
-6.064 bn
-5.07%
1 ene 2011 año
110.176 bn
-3.259 bn
-2.87%
1 ene 2012 año
109.503 bn
-673.094 millones
-0.61%
1 ene 2013 año
111.899 bn
+2.396 bn
2.19%
1 ene 2014 año
110.305 bn
-1.595 bn
-1.43%
1 ene 2015 año
115.771 bn
+5.467 bn
4.96%
Ranking de los países por los datos estadísticos actuales

Comentarios:

Enviar
PremiumAbout & FeedbackAcuerdoPrivacidad
logo
© 2022 Selected Technologies LLC – Morgan Hill, California