33
/es/
AIzaSyAYiBZKx7MnpbEhh9jyipgxe19OcubqV5w
May 1, 2025
168170
Kenya
KEN
true
2
1
Revenue, excluding grants (current LCU)
2014,2013,2012,2011,2010,2009,2008,2007,2006,2005,2004,2003,2002,2001,2000,1999,1998,1997,1996,1995,1994,1993,1992
Download
Estadísticas Globales de la Biblioteca →Kenya →

Revenue, excluding grants (current LCU)

Estas estadísticas en otros países:

AfghanistanAlbaniaAlgeriaAngolaAntigua and BarbudaArgentinaArmeniaAustraliaAustriaAzerbaijanBahamas, TheBahrainBangladeshBarbadosBelarusBelgiumBelizeBeninBhutanBoliviaBosnia and HerzegovinaBotswanaBrazilBulgariaBurkina FasoBurundiCabo VerdeCambodiaCanadaCentral African RepublicChileChinaColombiaCongo, Dem. Rep.Congo, Rep.Costa RicaCote d'IvoireCroatiaCyprusCzech RepublicDenmarkDominicaDominican RepublicEgypt, Arab Rep.El SalvadorEquatorial GuineaEstoniaEthiopiaFijiFinlandFranceGambia, TheGeorgiaGermanyGhanaGreeceGrenadaGuatemalaHondurasHong Kong SAR, ChinaHungaryIcelandIndiaIndonesiaIran, Islamic Rep.IraqIrelandIsraelItalyJamaicaJapanJordanKazakhstanKenyaKiribatiKorea, Rep.KuwaitKyrgyz RepublicLao PDRLatviaLebanonLesothoLiberiaLithuaniaLuxembourgMacao SAR, ChinaMacedonia, FYRMadagascarMalawiMalaysiaMaldivesMaliMaltaMauritiusMexicoMicronesia, Fed. Sts.MoldovaMongoliaMoroccoMozambiqueMyanmarNamibiaNepalNetherlandsNew ZealandNicaraguaNigeriaNorwayOmanPakistanPanamaPapua New GuineaParaguayPeruPhilippinesPolandPortugalQatarRomaniaRussian FederationRwandaSamoaSan MarinoSao Tome and PrincipeSenegalSerbiaSeychellesSierra LeoneSingaporeSlovak RepublicSloveniaSolomon IslandsSouth AfricaSpainSri LankaSt. Kitts and NevisSt. LuciaSt. Vincent and the GrenadinesSurinameSwazilandSwedenSwitzerlandSyrian Arab RepublicTajikistanTanzaniaThailandTimor-LesteTogoTrinidad and TobagoTunisiaTurkeyUgandaUkraineUnited Arab EmiratesUnited KingdomUnited StatesUruguayVanuatuVenezuela, RBVietnamWest Bank and GazaYemen, Rep.ZambiaZimbabwe

línea de tiempo (timeline):

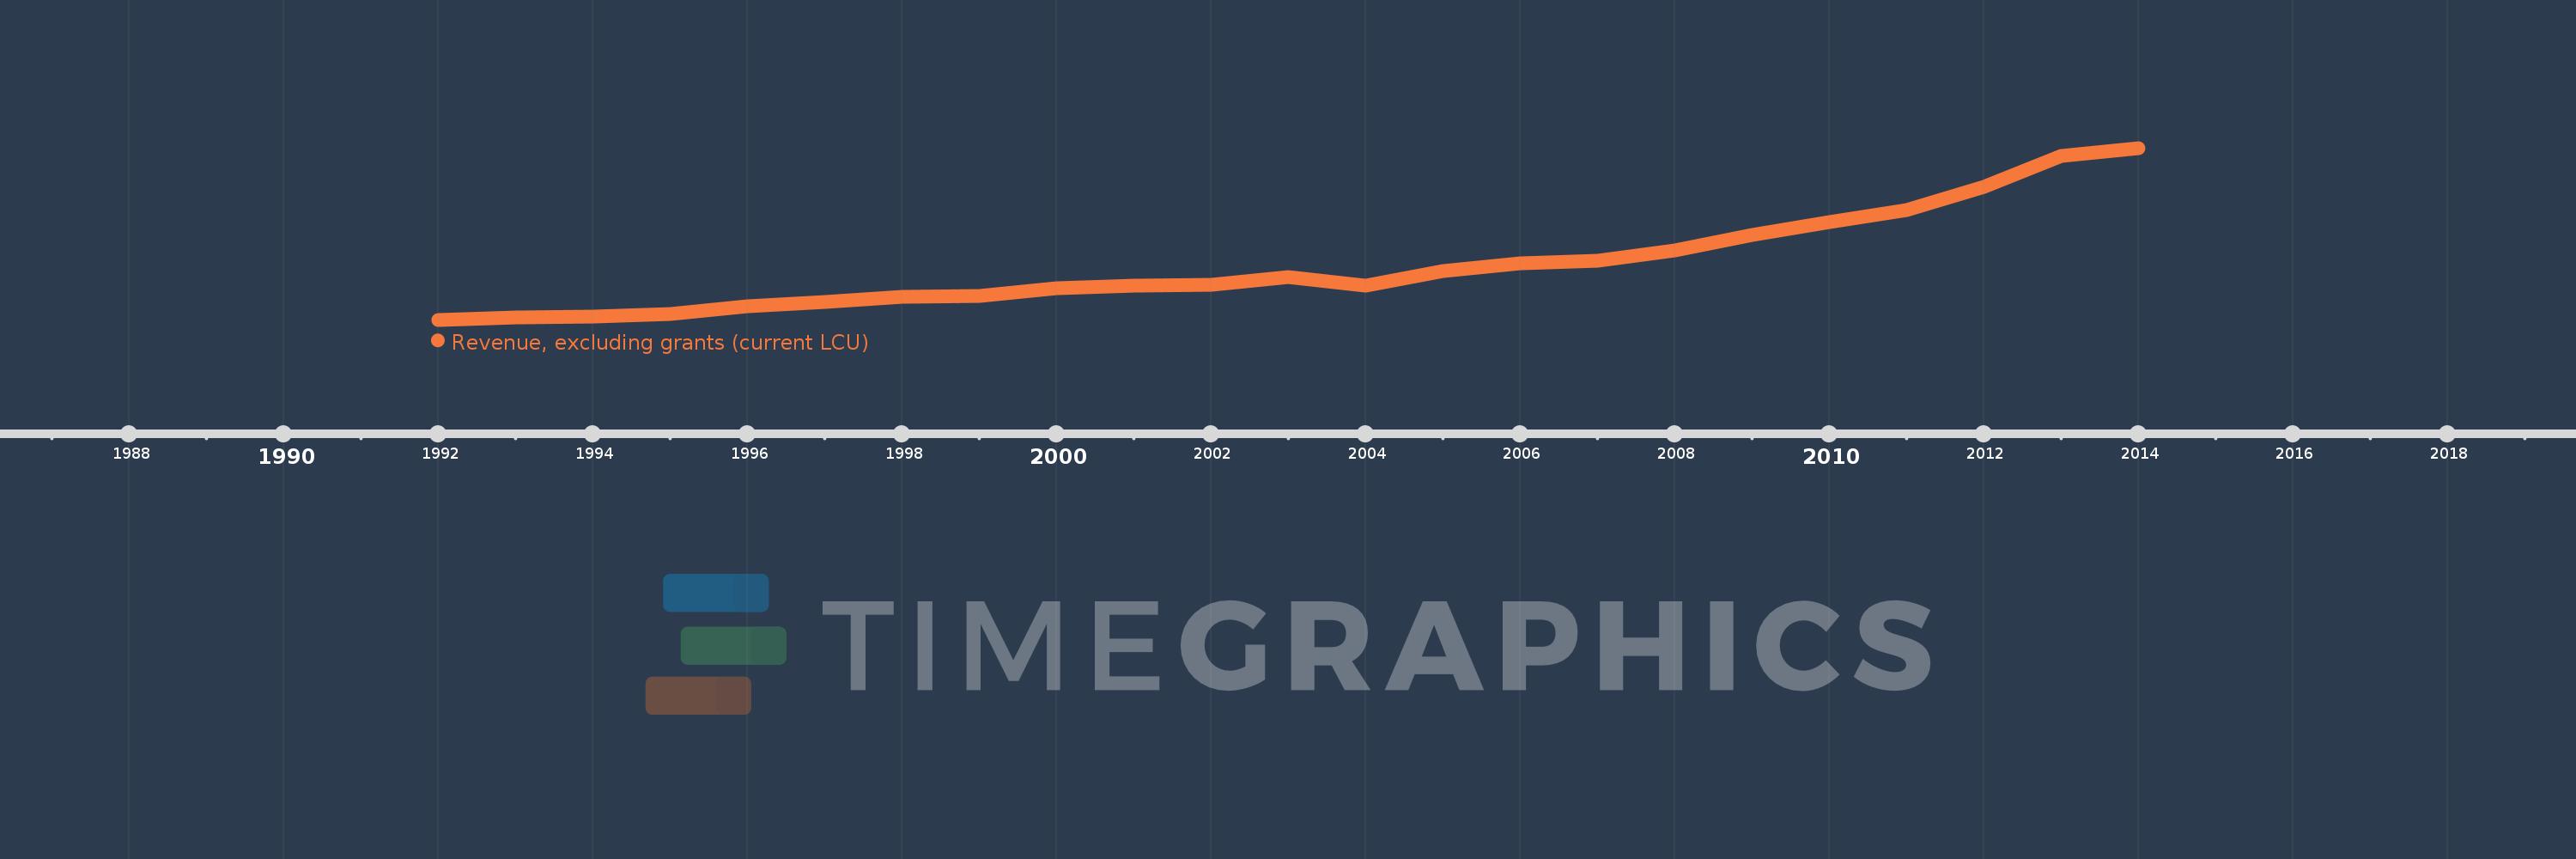
En esta escala de tiempo se presenta un gráfico de 1992 y 2014 de Kenya. Los datos de 1991 están ausentes. El número de observaciones reales por fecha: 23.

Fuente (nombre):

Indicadores del desarrollo mundial

Fuente (organización):

International Monetary Fund, Government Finance Statistics Yearbook and data files.

Categorías:

Public Sector

Se ha actualizado:

23 abr 2017 año

Los indicadores de los cambios de valor en los últimos años

En promedio:
279.843 bn
Mínimo:
43.744 bn
1 ene 1992 año
Máximo:
784.848 bn
1 ene 2014 año
A la fecha de observación
Valor
Cambio absoluto
El cambio con respecto al valor anterior
1 ene 1992 año
43.744 bn
+43.744 bn
0.0%
1 ene 1993 año
54.581 bn
+10.837 bn
24.77%
1 ene 1994 año
55.663 bn
+1.082 bn
1.98%
1 ene 1995 año
67.367 bn
+11.704 bn
21.03%
1 ene 1996 año
100.47 bn
+33.103 bn
49.14%
1 ene 1997 año
120.772 bn
+20.302 bn
20.21%
1 ene 1998 año
143.073 bn
+22.301 bn
18.47%
1 ene 1999 año
145.529 bn
+2.455 bn
1.72%
1 ene 2000 año
178.161 bn
+32.633 bn
22.42%
1 ene 2001 año
190.273 bn
+12.111 bn
6.8%
1 ene 2002 año
194.363 bn
+4.091 bn
2.15%
1 ene 2003 año
227.613 bn
+33.25 bn
17.11%
1 ene 2004 año
189.062 bn
-38.551 bn
-16.94%
1 ene 2005 año
254.696 bn
+65.634 bn
34.72%
1 ene 2006 año
286.394 bn
+31.698 bn
12.45%
1 ene 2007 año
297.785 bn
+11.391 bn
3.98%
1 ene 2008 año
343.533 bn
+45.748 bn
15.36%
1 ene 2009 año
409.027 bn
+65.494 bn
19.06%
1 ene 2010 año
465.27 bn
+56.244 bn
13.75%
1 ene 2011 año
518.218 bn
+52.947 bn
11.38%
1 ene 2012 año
617.12 bn
+98.902 bn
19.09%
1 ene 2013 año
748.827 bn
+131.707 bn
21.34%
1 ene 2014 año
784.848 bn
+36.021 bn
4.81%

Ranking de los países por los datos estadísticos actuales