29
/es/
es
AIzaSyAYiBZKx7MnpbEhh9jyipgxe19OcubqV5w
April 1, 2024
194890
Mauritius
MUS
true
2
1
Revenue, excluding grants (current LCU)
2015,2014,2013,2012,2011,2010,2009,2008,2007,2006,2005,2004,2003,2002,2001,2000,1999,1998,1997,1996,1995,1994,1993,1992,1991
Download
Estadísticas Globales de la Biblioteca →Mauritius →

Revenue, excluding grants (current LCU)

Estas estadísticas en otros países:
AfghanistanAlbaniaAlgeriaAngolaAntigua and BarbudaArgentinaArmeniaAustraliaAustriaAzerbaijanBahamas, TheBahrainBangladeshBarbadosBelarusBelgiumBelizeBeninBhutanBoliviaBosnia and HerzegovinaBotswanaBrazilBulgariaBurkina FasoBurundiCabo VerdeCambodiaCanadaCentral African RepublicChileChinaColombiaCongo, Dem. Rep.Congo, Rep.Costa RicaCote d'IvoireCroatiaCyprusCzech RepublicDenmarkDominicaDominican RepublicEgypt, Arab Rep.El SalvadorEquatorial GuineaEstoniaEthiopiaFijiFinlandFranceGambia, TheGeorgiaGermanyGhanaGreeceGrenadaGuatemalaHondurasHong Kong SAR, ChinaHungaryIcelandIndiaIndonesiaIran, Islamic Rep.IraqIrelandIsraelItalyJamaicaJapanJordanKazakhstanKenyaKiribatiKorea, Rep.KuwaitKyrgyz RepublicLao PDRLatviaLebanonLesothoLiberiaLithuaniaLuxembourgMacao SAR, ChinaMacedonia, FYRMadagascarMalawiMalaysiaMaldivesMaliMaltaMauritiusMexicoMicronesia, Fed. Sts.MoldovaMongoliaMoroccoMozambiqueMyanmarNamibiaNepalNetherlandsNew ZealandNicaraguaNigeriaNorwayOmanPakistanPanamaPapua New GuineaParaguayPeruPhilippinesPolandPortugalQatarRomaniaRussian FederationRwandaSamoaSan MarinoSao Tome and PrincipeSenegalSerbiaSeychellesSierra LeoneSingaporeSlovak RepublicSloveniaSolomon IslandsSouth AfricaSpainSri LankaSt. Kitts and NevisSt. LuciaSt. Vincent and the GrenadinesSurinameSwazilandSwedenSwitzerlandSyrian Arab RepublicTajikistanTanzaniaThailandTimor-LesteTogoTrinidad and TobagoTunisiaTurkeyUgandaUkraineUnited Arab EmiratesUnited KingdomUnited StatesUruguayVanuatuVenezuela, RBVietnamWest Bank and GazaYemen, Rep.ZambiaZimbabwe
línea de tiempo (timeline):
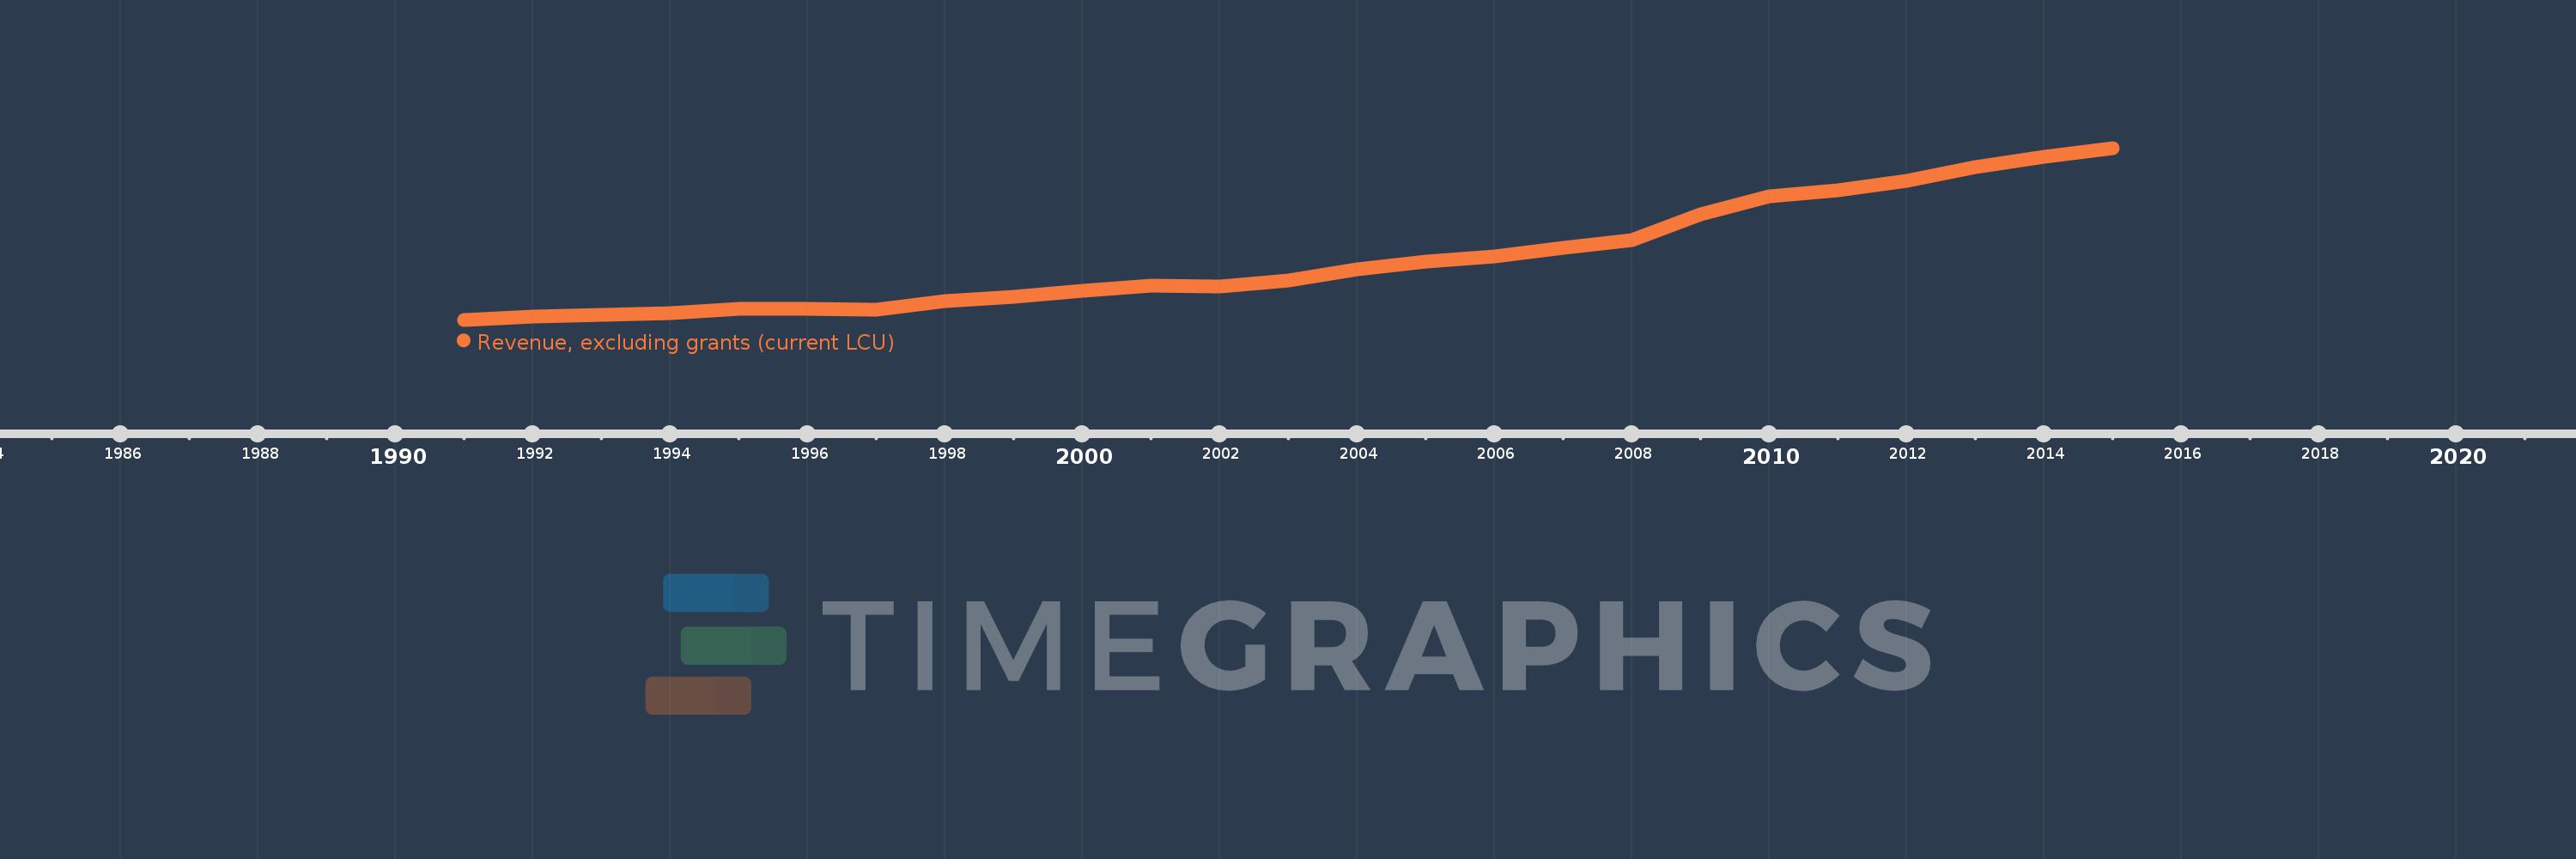
En esta escala de tiempo se presenta un gráfico de 1991 y 2015 de Mauritius. Los datos de 1990 están ausentes. El número de observaciones reales por fecha: 25.
Fuente (nombre):
Indicadores del desarrollo mundial
Fuente (organización):
International Monetary Fund, Government Finance Statistics Yearbook and data files.
Categorías:
Public Sector
Se ha actualizado:
23 abr 2017 año
Los indicadores de los cambios de valor en los últimos años
En promedio:
34.169 bn
Mínimo:
8.3 bn
1 ene 1991 año
Máximo:
80.82 bn
1 ene 2015 año
A la fecha de observación
Valor
Cambio absoluto
El cambio con respecto al valor anterior
1 ene 1991 año
8.3 bn
+8.3 bn
0.0%
1 ene 1992 año
9.475 bn
+1.176 bn
14.17%
1 ene 1993 año
10.463 bn
+988.2 millones
10.43%
1 ene 1994 año
11.211 bn
+747.8 millones
7.15%
1 ene 1995 año
12.735 bn
+1.524 bn
13.59%
1 ene 1996 año
12.756 bn
+20.9 millones
0.16%
1 ene 1997 año
12.502 bn
-253.7 millones
-1.99%
1 ene 1998 año
16.285 bn
+3.782 bn
30.25%
1 ene 1999 año
18.148 bn
+1.863 bn
11.44%
1 ene 2000 año
20.543 bn
+2.395 bn
13.2%
1 ene 2001 año
22.751 bn
+2.208 bn
10.75%
1 ene 2002 año
22.433 bn
-317.5 millones
-1.4%
1 ene 2003 año
24.785 bn
+2.351 bn
10.48%
1 ene 2004 año
29.733 bn
+4.949 bn
19.97%
1 ene 2005 año
32.906 bn
+3.173 bn
10.67%
1 ene 2006 año
35.192 bn
+2.286 bn
6.95%
1 ene 2007 año
38.509 bn
+3.316 bn
9.42%
1 ene 2008 año
41.818 bn
+3.309 bn
8.59%
1 ene 2009 año
52.744 bn
+10.926 bn
26.13%
1 ene 2010 año
60.562 bn
+7.817 bn
14.82%
1 ene 2011 año
62.928 bn
+2.366 bn
3.91%
1 ene 2012 año
66.825 bn
+3.897 bn
6.19%
1 ene 2013 año
72.649 bn
+5.824 bn
8.72%
1 ene 2014 año
77.15 bn
+4.501 bn
6.2%
1 ene 2015 año
80.82 bn
+3.669 bn
4.76%
Ranking de los países por los datos estadísticos actuales

Comentarios:

Enviar
PremiumAbout & FeedbackAcuerdoPrivacidad
logo
© 2022 Selected Technologies LLC – Morgan Hill, California