33
/de/
AIzaSyB4mHJ5NPEv-XzF7P6NDYXjlkCWaeKw5bc
November 30, 2025
230932
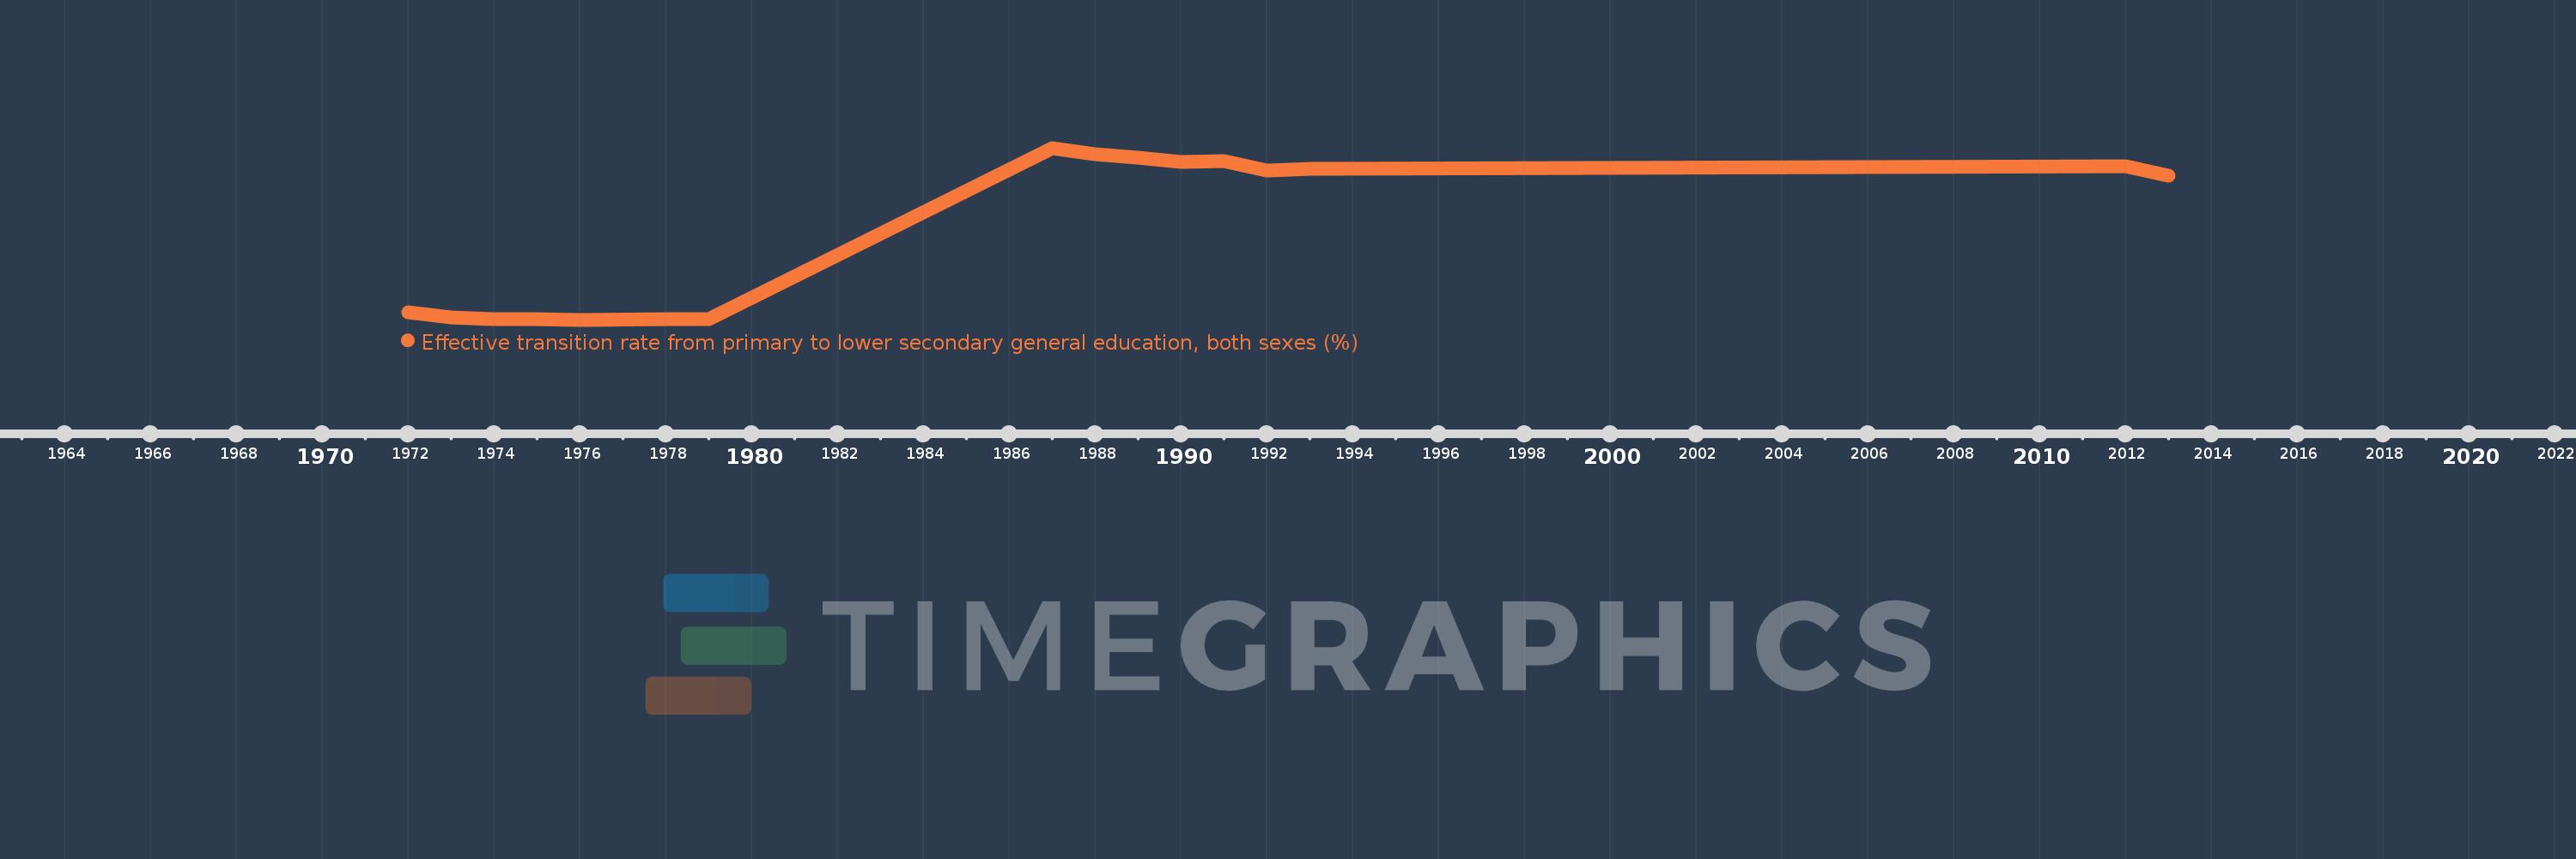
Rwanda
RWA
true
2
1
Effective transition rate from primary to lower secondary general education, both sexes (%)
2013,2012,1993,1992,1991,1990,1989,1988,1987,1979,1978,1976,1975,1974,1973,1972