33
/de/
AIzaSyB4mHJ5NPEv-XzF7P6NDYXjlkCWaeKw5bc
November 1, 2025
147847
Guyana
GUY
true
2
1
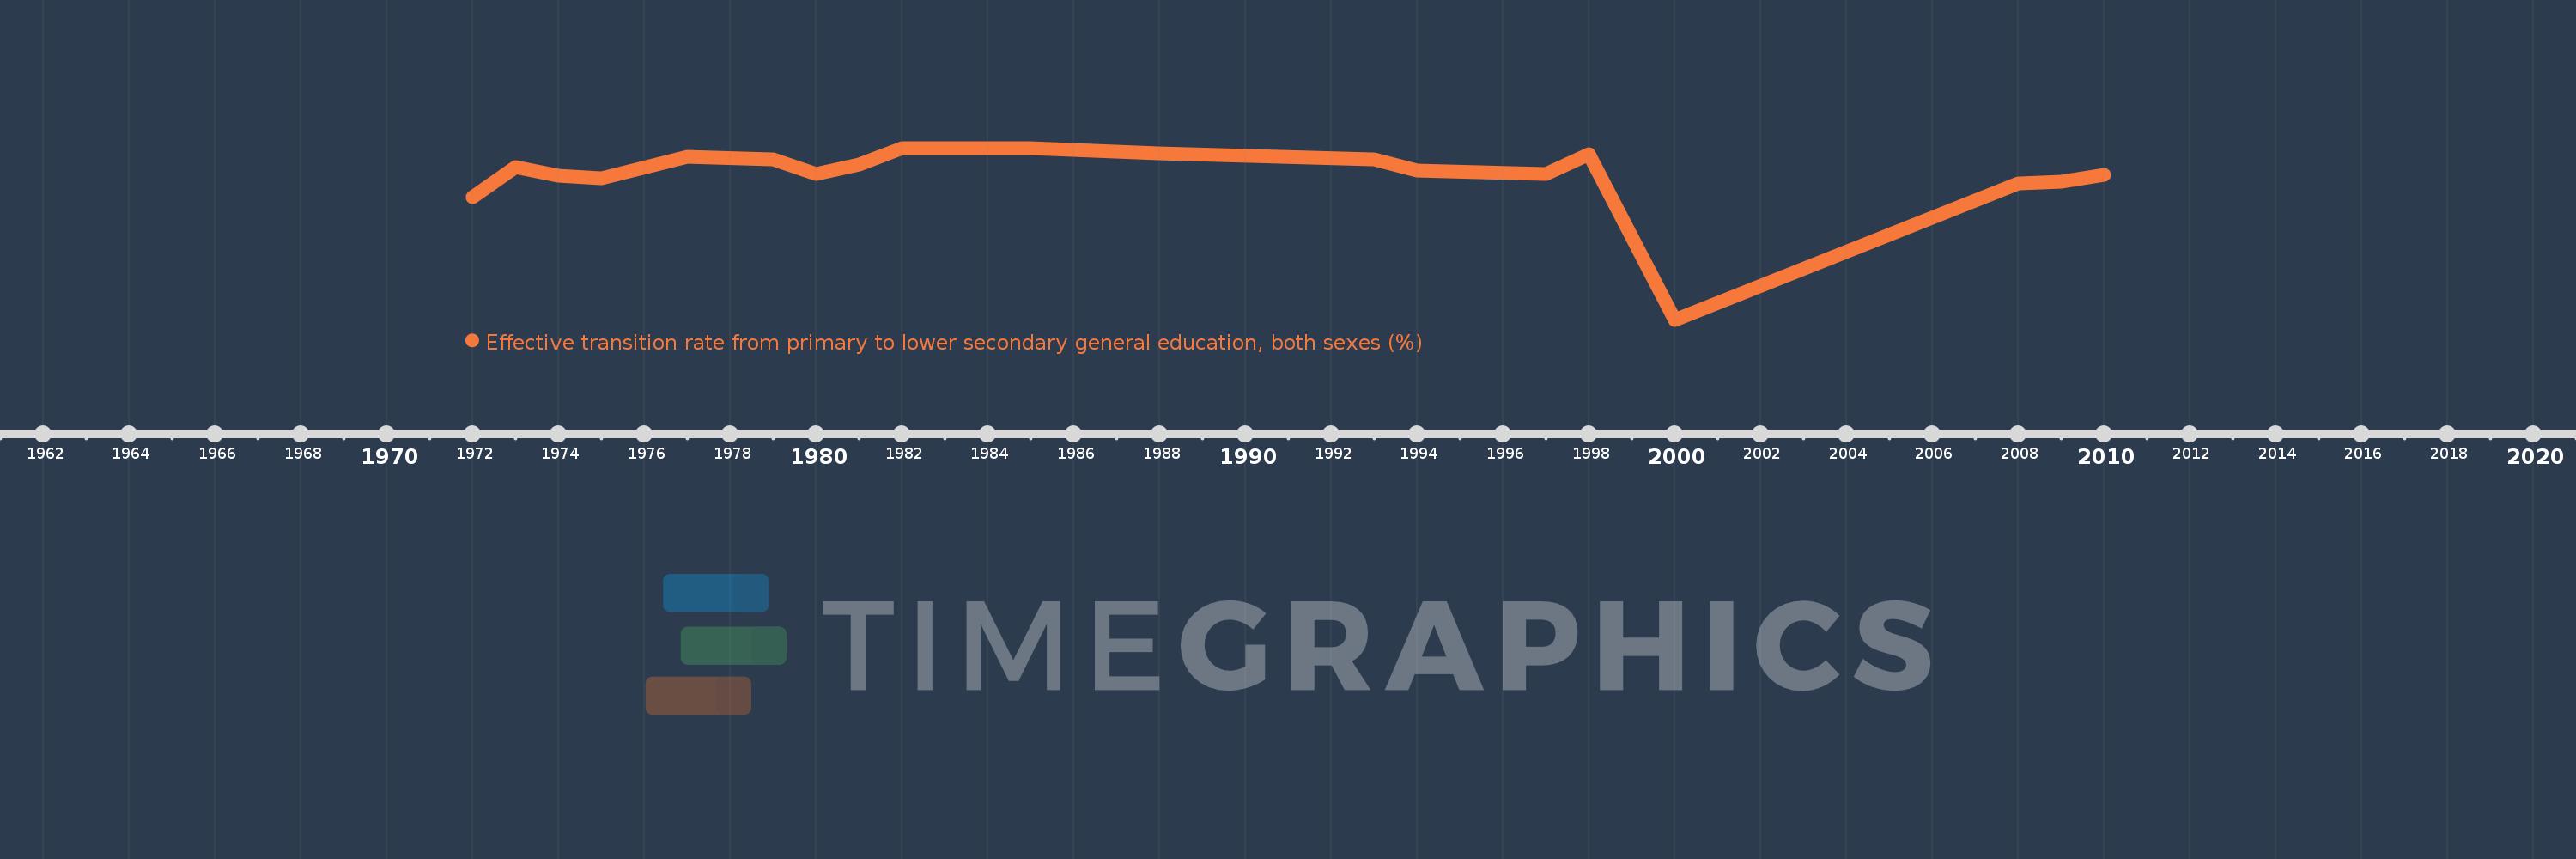
Effective transition rate from primary to lower secondary general education, both sexes (%)
2010,2009,2008,2000,1998,1997,1994,1993,1988,1985,1984,1983,1982,1981,1980,1979,1977,1975,1974,1973,1972