33
/de/
AIzaSyB4mHJ5NPEv-XzF7P6NDYXjlkCWaeKw5bc
November 1, 2025
119790
Djibouti
DJI
true
2
1
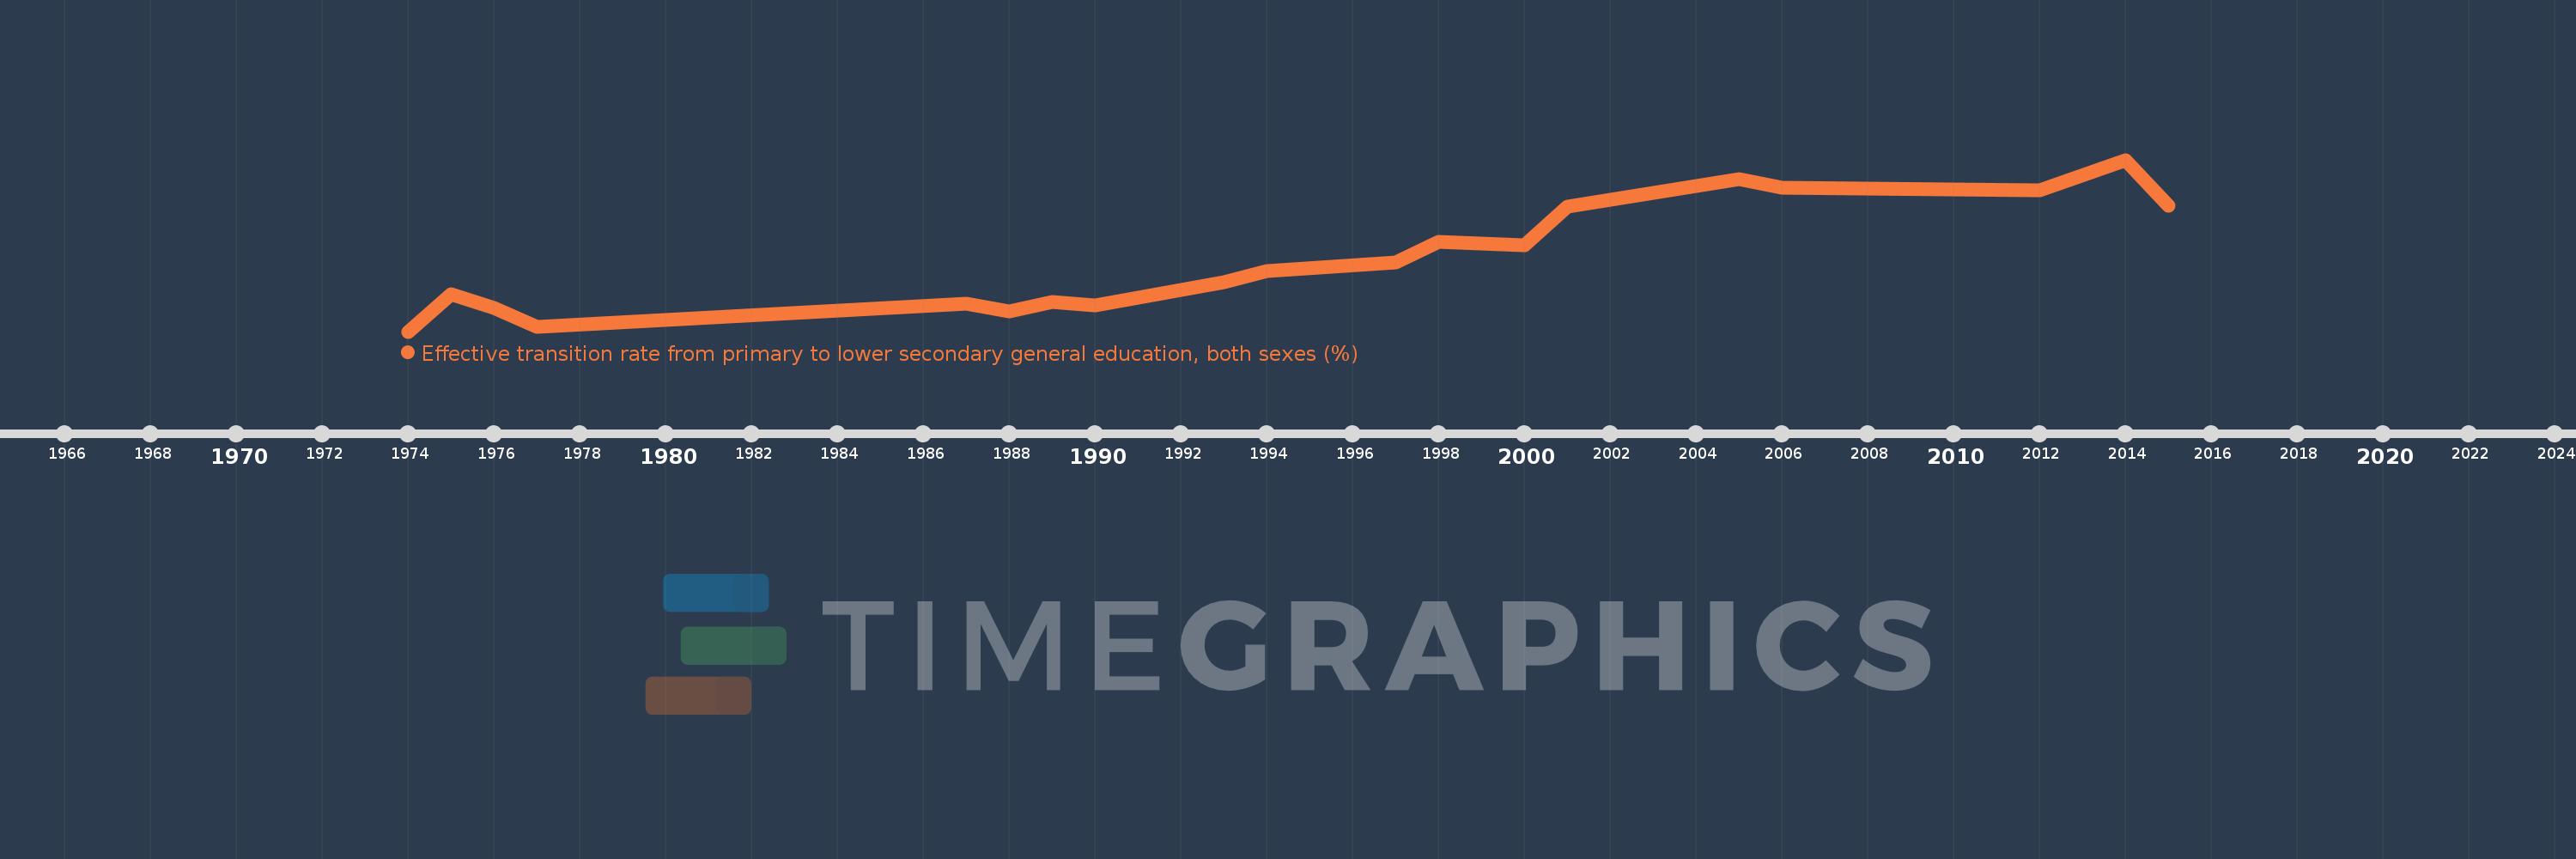
Effective transition rate from primary to lower secondary general education, both sexes (%)
2015,2014,2012,2006,2005,2001,2000,1998,1997,1994,1993,1990,1989,1988,1987,1977,1976,1975,1974