29
/
en
AIzaSyAYiBZKx7MnpbEhh9jyipgxe19OcubqV5w
April 1, 2024
98252
Cambodia
KHM
true
2
1
Battle-related deaths (number of people)
2012,1999,1998,1997,1996,1995,1994,1993,1992,1991,1990
This statistics in other country:
Timeline:
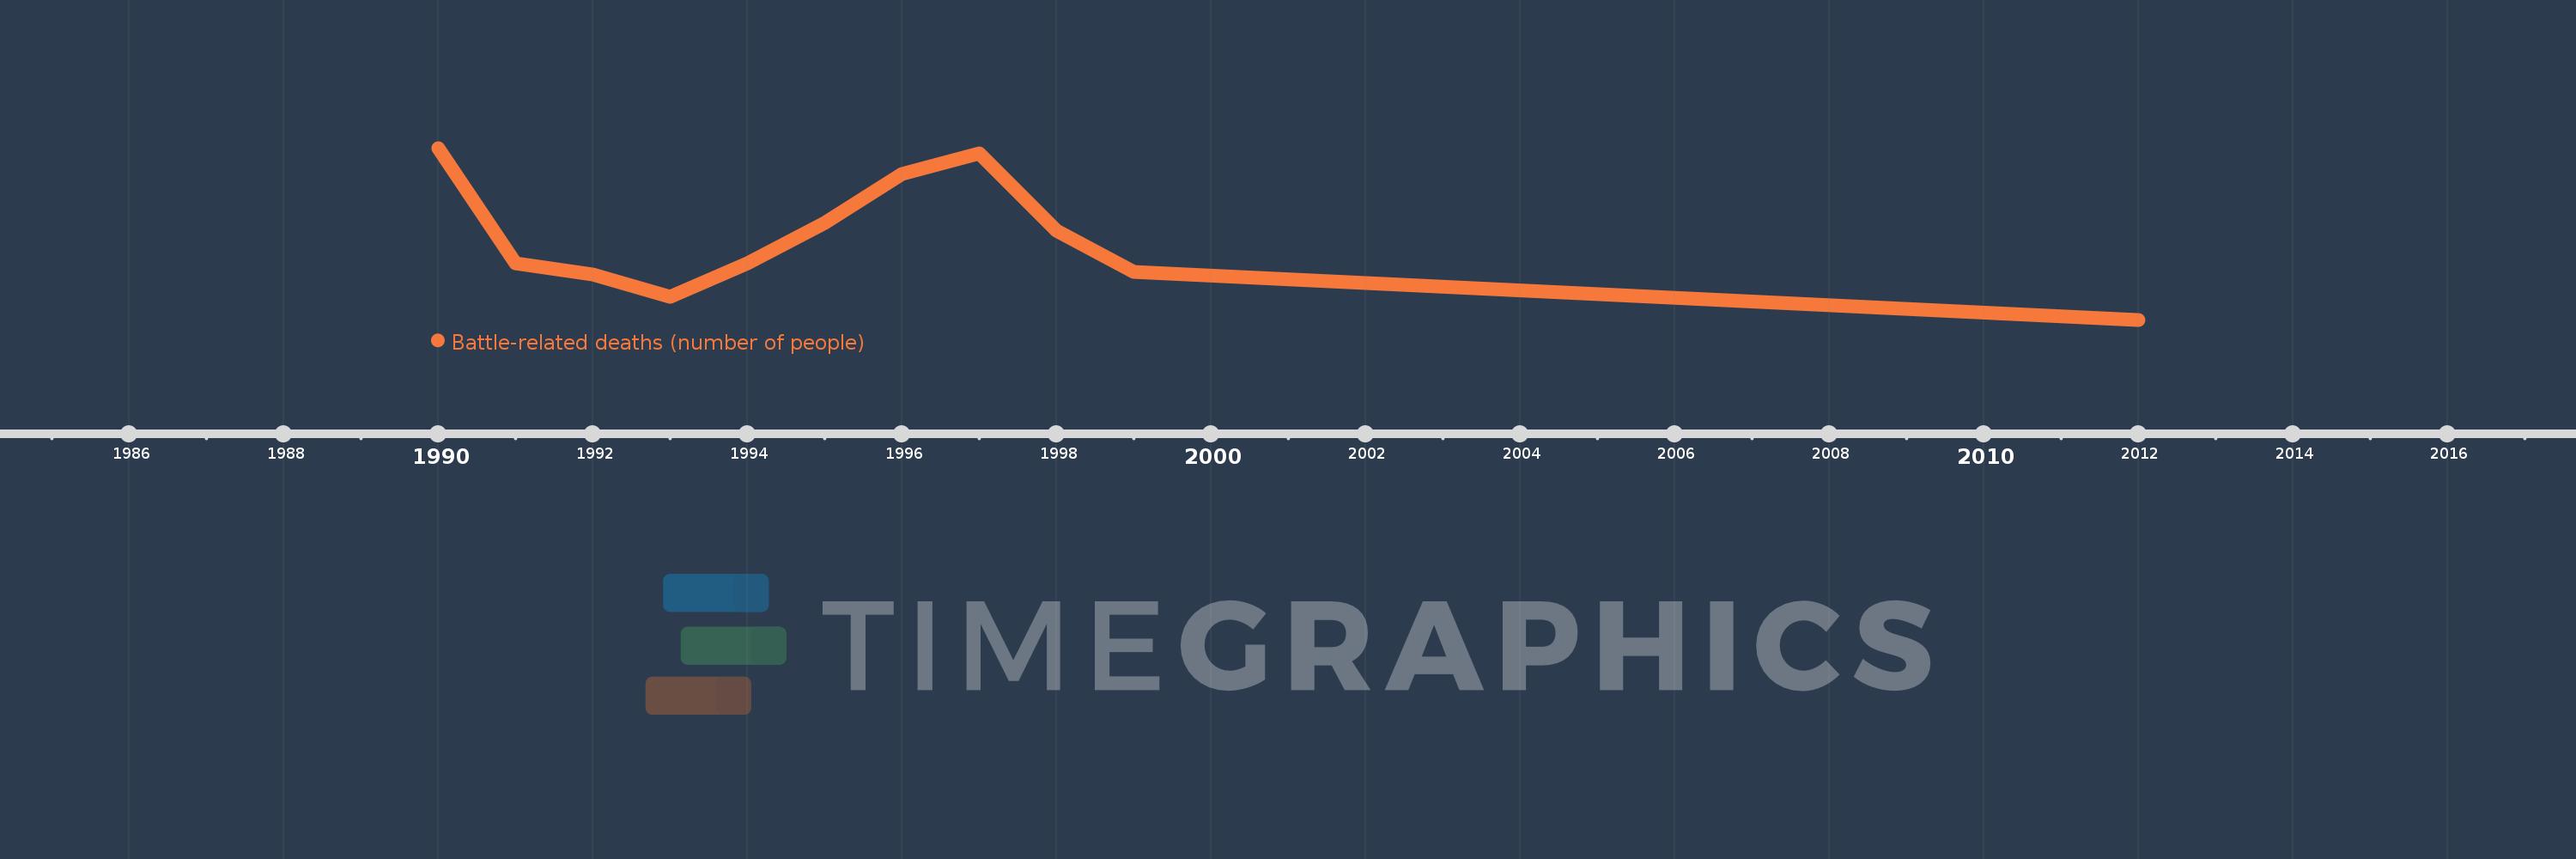
This timeline shows a graph from 1990 to 2012 of Cambodia. No data until 1989. Number of actual observations by date: 11.
Source name:
World Development Indicators
Source organization:
Uppsala Conflict Data Program, http://www.pcr.uu.se/research/UCDP/.
Categories, topics:
Public Sector
Last updated:
apr 23, 2017
Indicators value changes by year
At the date of observation
Value
Absolute change
Change from previous value
jan 1, 1990
814.0
+814.0
0.0%
jan 1, 1991
274.0
-540.0
-66.34%
jan 1, 1992
220.0
-54.0
-19.71%
jan 1, 1993
118.0
-102.0
-46.36%
jan 1, 1994
274.0
+156.0
132.2%
jan 1, 1995
464.0
+190.0
69.34%
jan 1, 1996
694.0
+230.0
49.57%
jan 1, 1997
788.0
+94.0
13.54%
jan 1, 1998
426.0
-362.0
-45.94%
jan 1, 1999
232.0
-194.0
-45.54%
jan 1, 2012
10.0
-222.0
-95.69%
Ranking of countries by current statistics by years


Comments: