This statistics in other country:
Timeline:
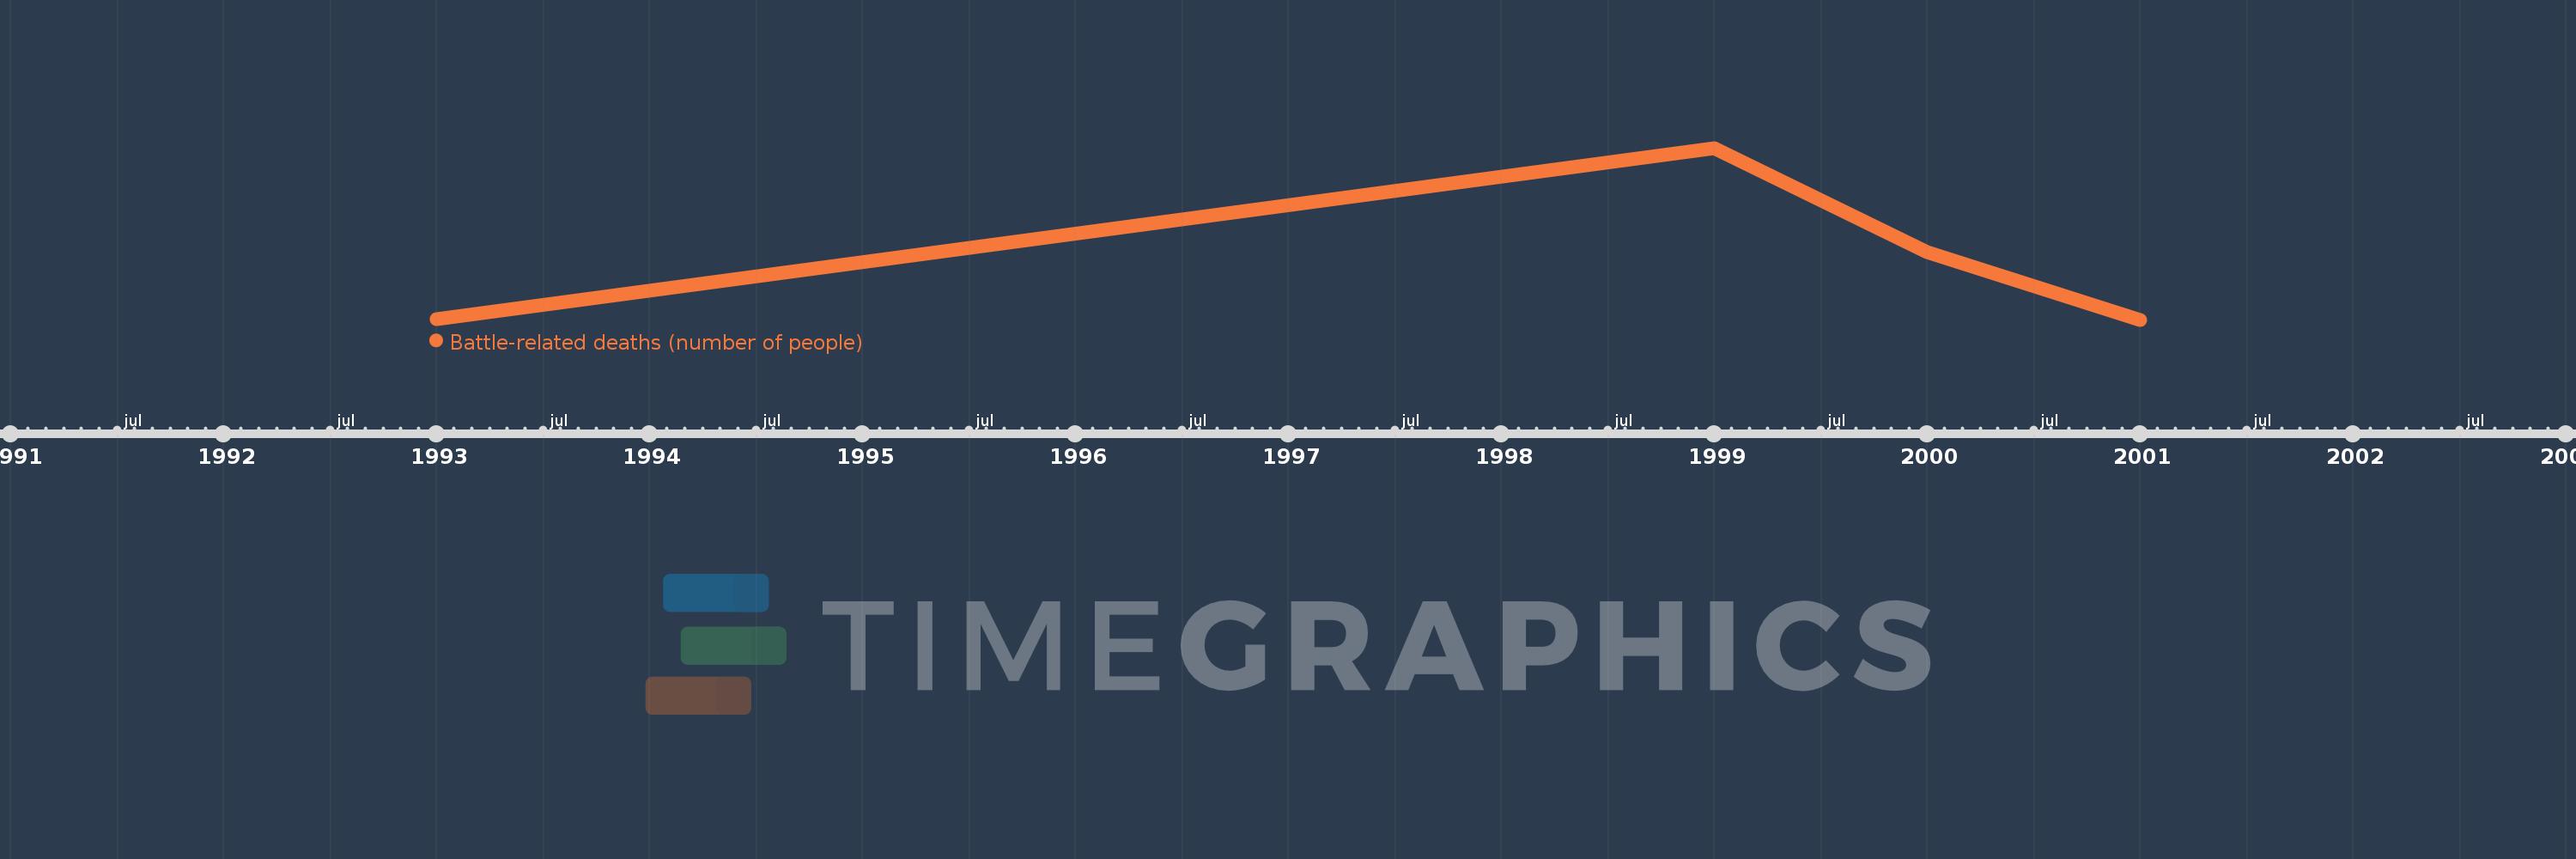
This timeline shows a graph from 1993 to 2001 of Guinea-Bissau. No data until 1992. Number of actual observations by date: 4.
Source name:
World Development Indicators
Source organization:
Uppsala Conflict Data Program, http://www.pcr.uu.se/research/UCDP/.
Categories, topics:
Public Sector
Last updated:
apr 23, 2017
Indicators value changes by year
At the date of observation
Value
Absolute change
Change from previous value
jan 1, 1999
505.0
+503.0
25.15K%
jan 1, 2000
199.0
-306.0
-60.59%
jan 1, 2001
0.0
-199.0
-100.0%
Ranking of countries by current statistics by years


Comments: