This statistics in other country:
Timeline:
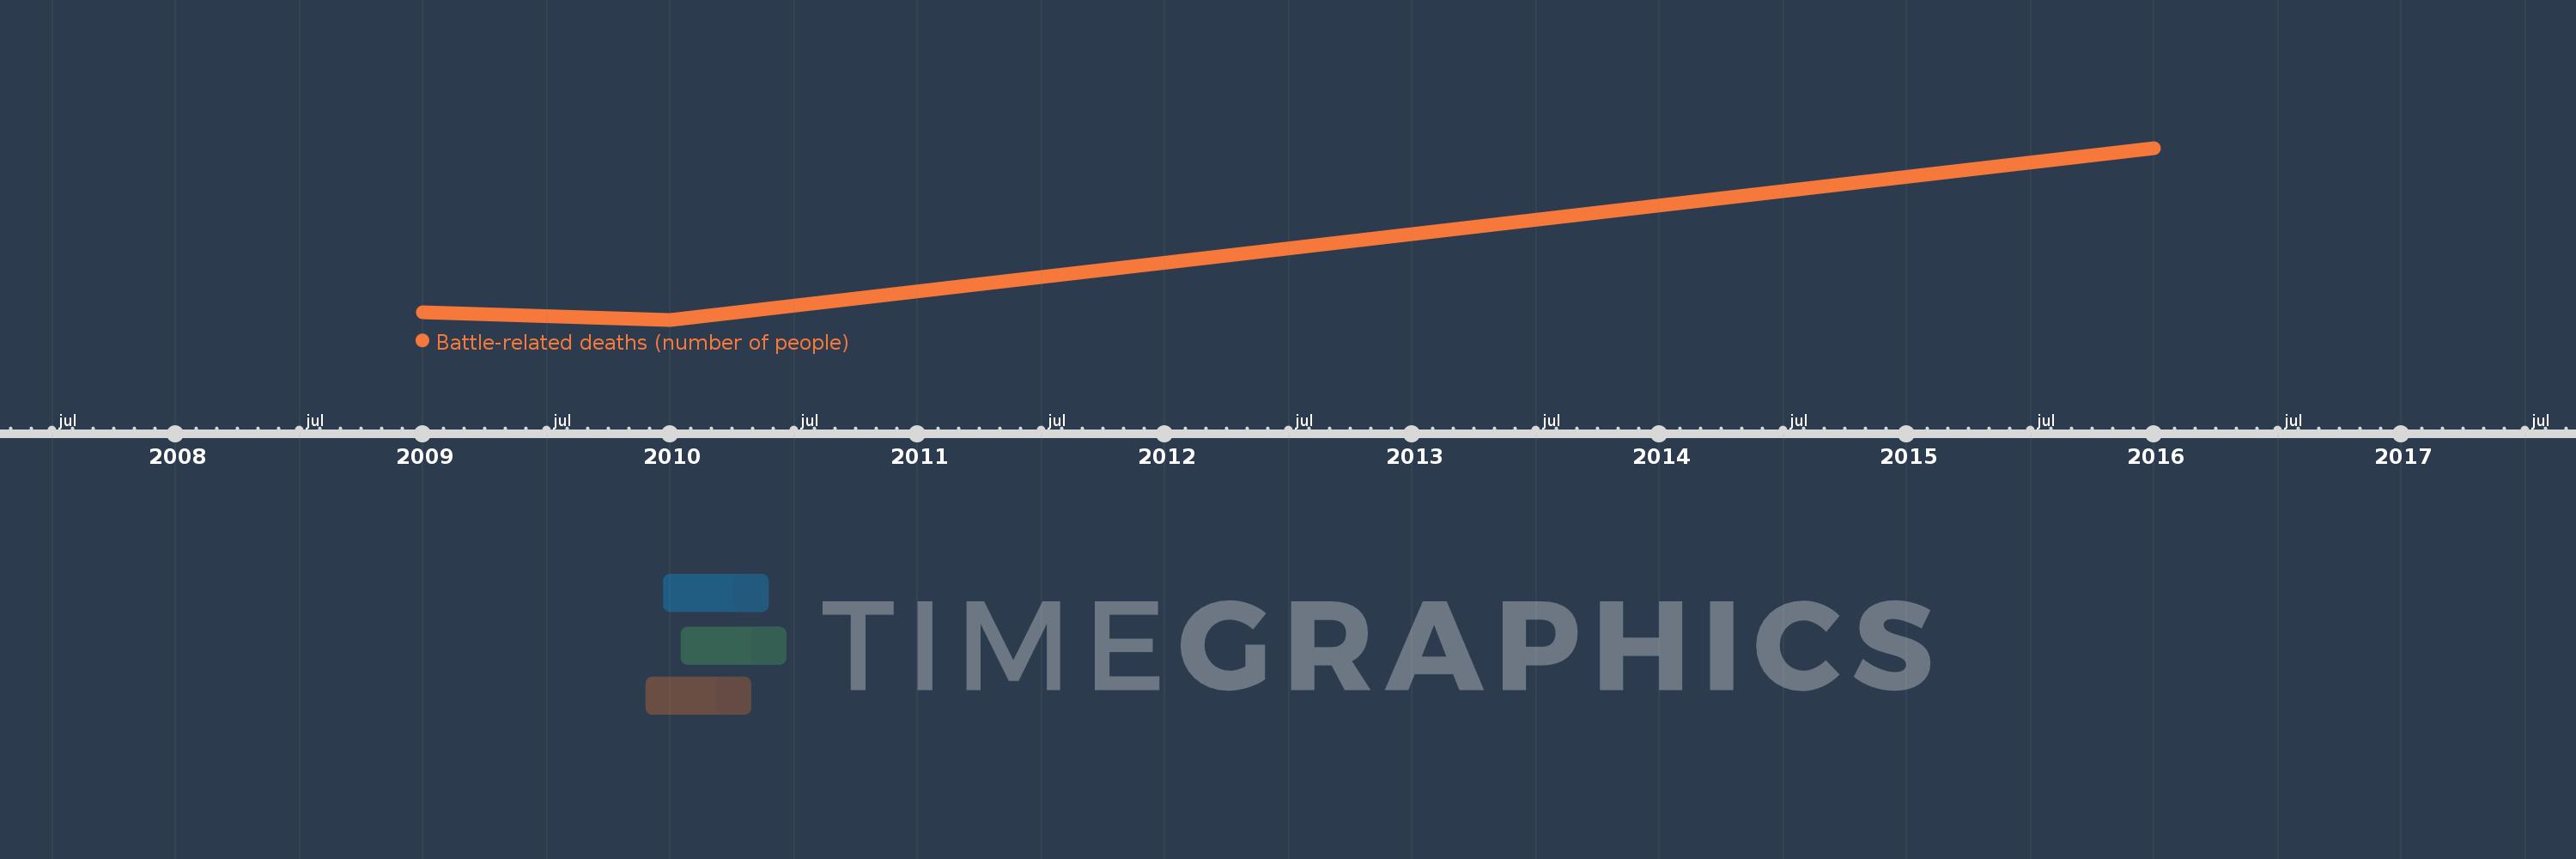
This timeline shows a graph from 2009 to 2016 of Upper middle income. No data until 2008. Number of actual observations by date: 3.
Source name:
World Development Indicators
Source organization:
Uppsala Conflict Data Program, http://www.pcr.uu.se/research/UCDP/.
Categories, topics:
Public Sector
Last updated:
apr 23, 2017
Indicators value changes by year
Minimum:
5.073K
jan 1, 2010
Maximum:
11.791K
jan 1, 2016
At the date of observation
Value
Absolute change
Change from previous value
jan 1, 2009
5.375K
+5.375K
0.0%
jan 1, 2010
5.073K
-302.0
-5.62%
jan 1, 2016
11.791K
+6.718K
132.43%
Ranking of countries by current statistics by years


Comments: