29
/
en
AIzaSyAYiBZKx7MnpbEhh9jyipgxe19OcubqV5w
April 1, 2024
155633
Indonesia
IDN
true
2
1
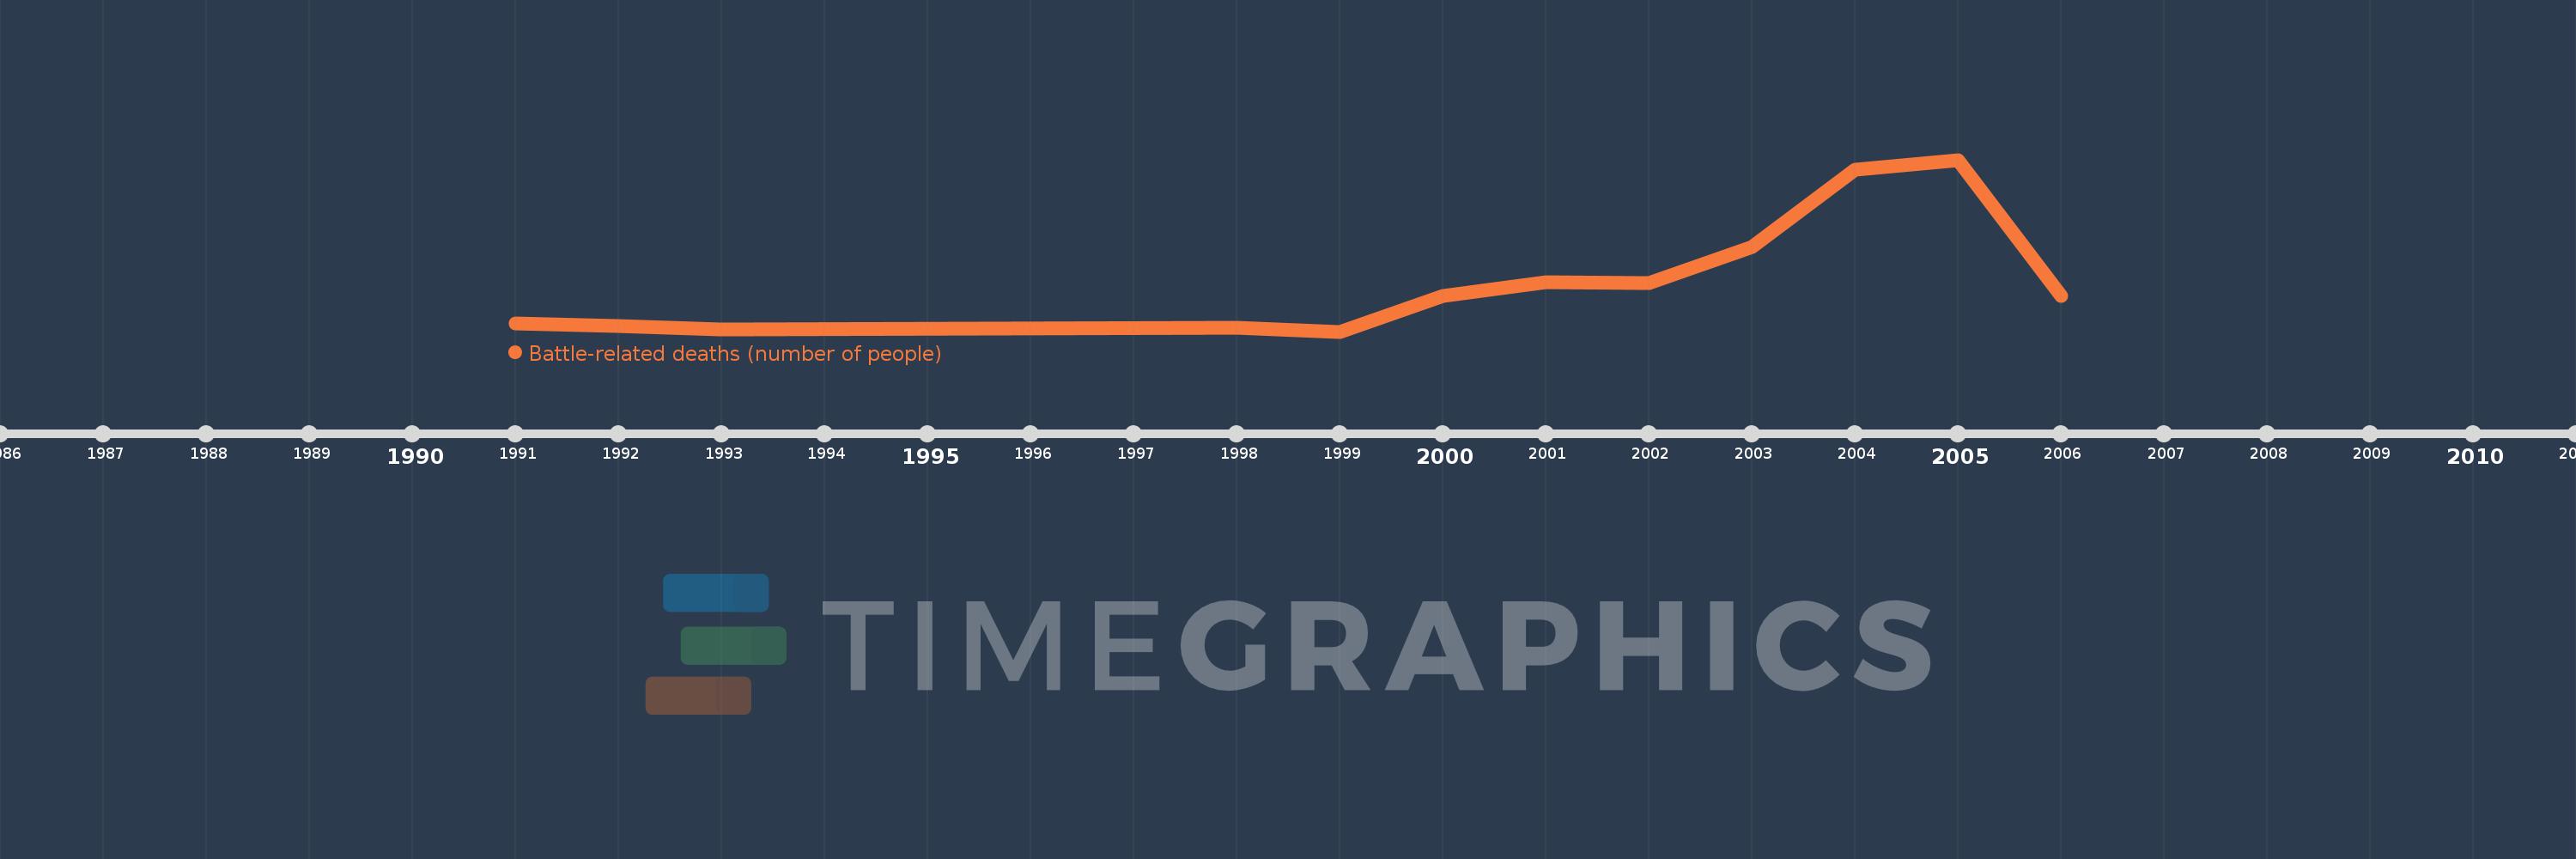
Battle-related deaths (number of people)
2006,2005,2004,2003,2002,2001,2000,1999,1998,1993,1992,1991
This statistics in other country:
Timeline:
This timeline shows a graph from 1991 to 2006 of Indonesia. No data until 1990. Number of actual observations by date: 12.
Source name:
World Development Indicators
Source organization:
Uppsala Conflict Data Program, http://www.pcr.uu.se/research/UCDP/.
Categories, topics:
Public Sector
Last updated:
apr 23, 2017
Indicators value changes by year
At the date of observation
Value
Absolute change
Change from previous value
jan 1, 1991
72.0
+72.0
0.0%
jan 1, 1992
58.0
-14.0
-19.44%
jan 1, 1993
39.0
-19.0
-32.76%
jan 1, 1998
51.0
+12.0
30.77%
jan 1, 1999
30.0
-21.0
-41.18%
jan 1, 2000
213.0
+183.0
610.0%
jan 1, 2001
286.0
+73.0
34.27%
jan 1, 2002
278.0
-8.0
-2.8%
jan 1, 2003
466.0
+188.0
67.63%
jan 1, 2004
863.0
+397.0
85.19%
jan 1, 2005
915.0
+52.0
6.03%
jan 1, 2006
213.0
-702.0
-76.72%
Ranking of countries by current statistics by years


Comments: