29
/
en
AIzaSyAYiBZKx7MnpbEhh9jyipgxe19OcubqV5w
April 1, 2024
244438
Somalia
SOM
true
2
1
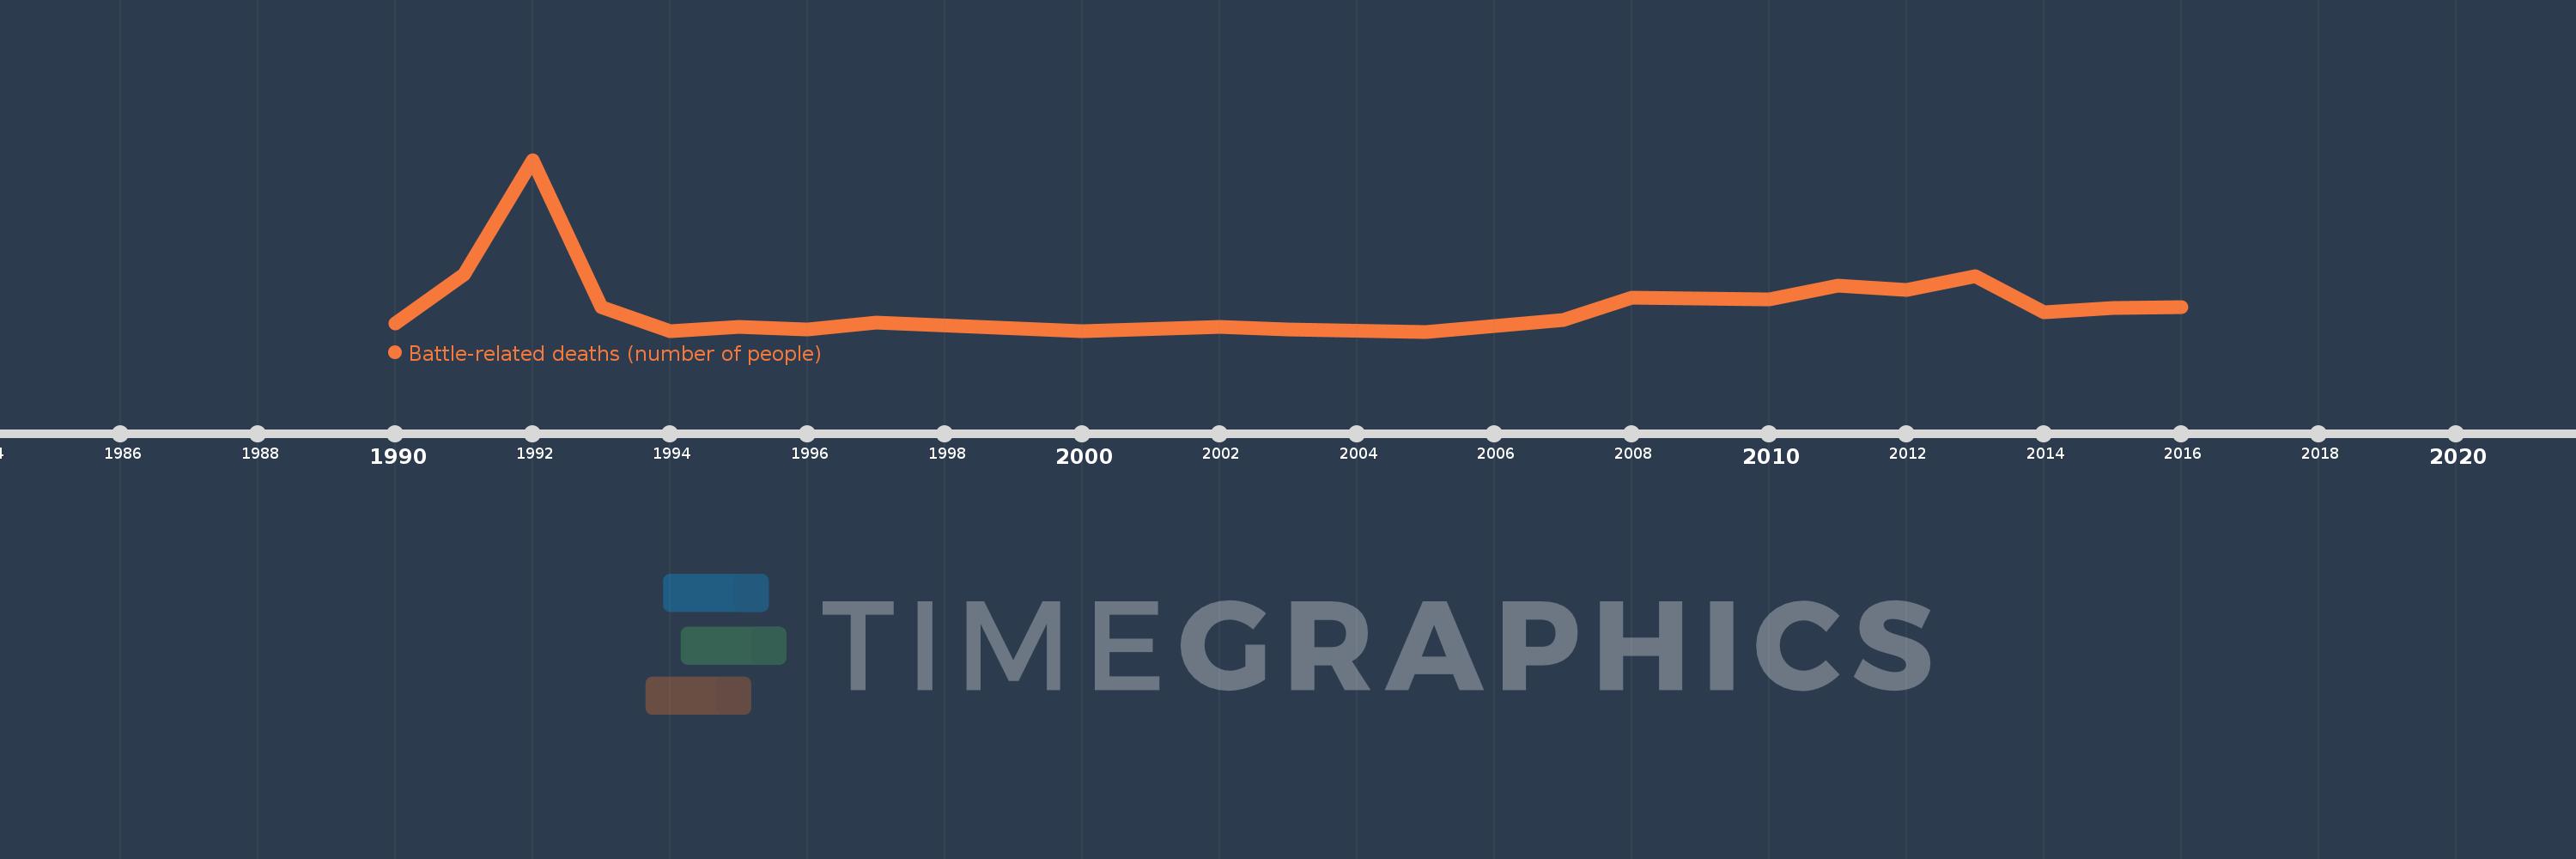
Battle-related deaths (number of people)
2016,2015,2014,2013,2012,2011,2010,2009,2008,2007,2005,2003,2002,2000,1997,1996,1995,1994,1993,1992,1991,1990
This statistics in other country:
Timeline:
This timeline shows a graph from 1990 to 2016 of Somalia. No data until 1989. Number of actual observations by date: 22.
Source name:
World Development Indicators
Source organization:
Uppsala Conflict Data Program, http://www.pcr.uu.se/research/UCDP/.
Categories, topics:
Public Sector
Last updated:
apr 23, 2017
Indicators value changes by year
Maximum:
8.005K
jan 1, 1992
At the date of observation
Value
Absolute change
Change from previous value
jan 1, 1990
373.0
+373.0
0.0%
jan 1, 1991
2.65K
+2.277K
610.46%
jan 1, 1992
8.005K
+5.355K
202.08%
jan 1, 1993
1.154K
-6.851K
-85.58%
jan 1, 1994
25.0
-1.129K
-97.83%
jan 1, 1995
237.0
+212.0
848.0%
jan 1, 1996
104.0
-133.0
-56.12%
jan 1, 1997
440.0
+336.0
323.08%
jan 1, 2000
25.0
-415.0
-94.32%
jan 1, 2002
228.0
+203.0
812.0%
jan 1, 2003
114.0
-114.0
-50.0%
jan 1, 2005
0.0
-114.0
-100.0%
jan 1, 2007
547.0
+547.0
%
jan 1, 2008
1.579K
+1.032K
188.67%
jan 1, 2009
1.529K
-50.0
-3.17%
jan 1, 2010
1.481K
-48.0
-3.14%
jan 1, 2011
2.151K
+670.0
45.24%
jan 1, 2012
1.937K
-214.0
-9.95%
jan 1, 2013
2.6K
+663.0
34.23%
jan 1, 2014
896.0
-1.704K
-65.54%
jan 1, 2015
1.104K
+208.0
23.21%
jan 1, 2016
1.156K
+52.0
4.71%
Ranking of countries by current statistics by years


Comments: