29
/
en
AIzaSyAYiBZKx7MnpbEhh9jyipgxe19OcubqV5w
April 1, 2024
176121
Lebanon
LBN
true
2
1
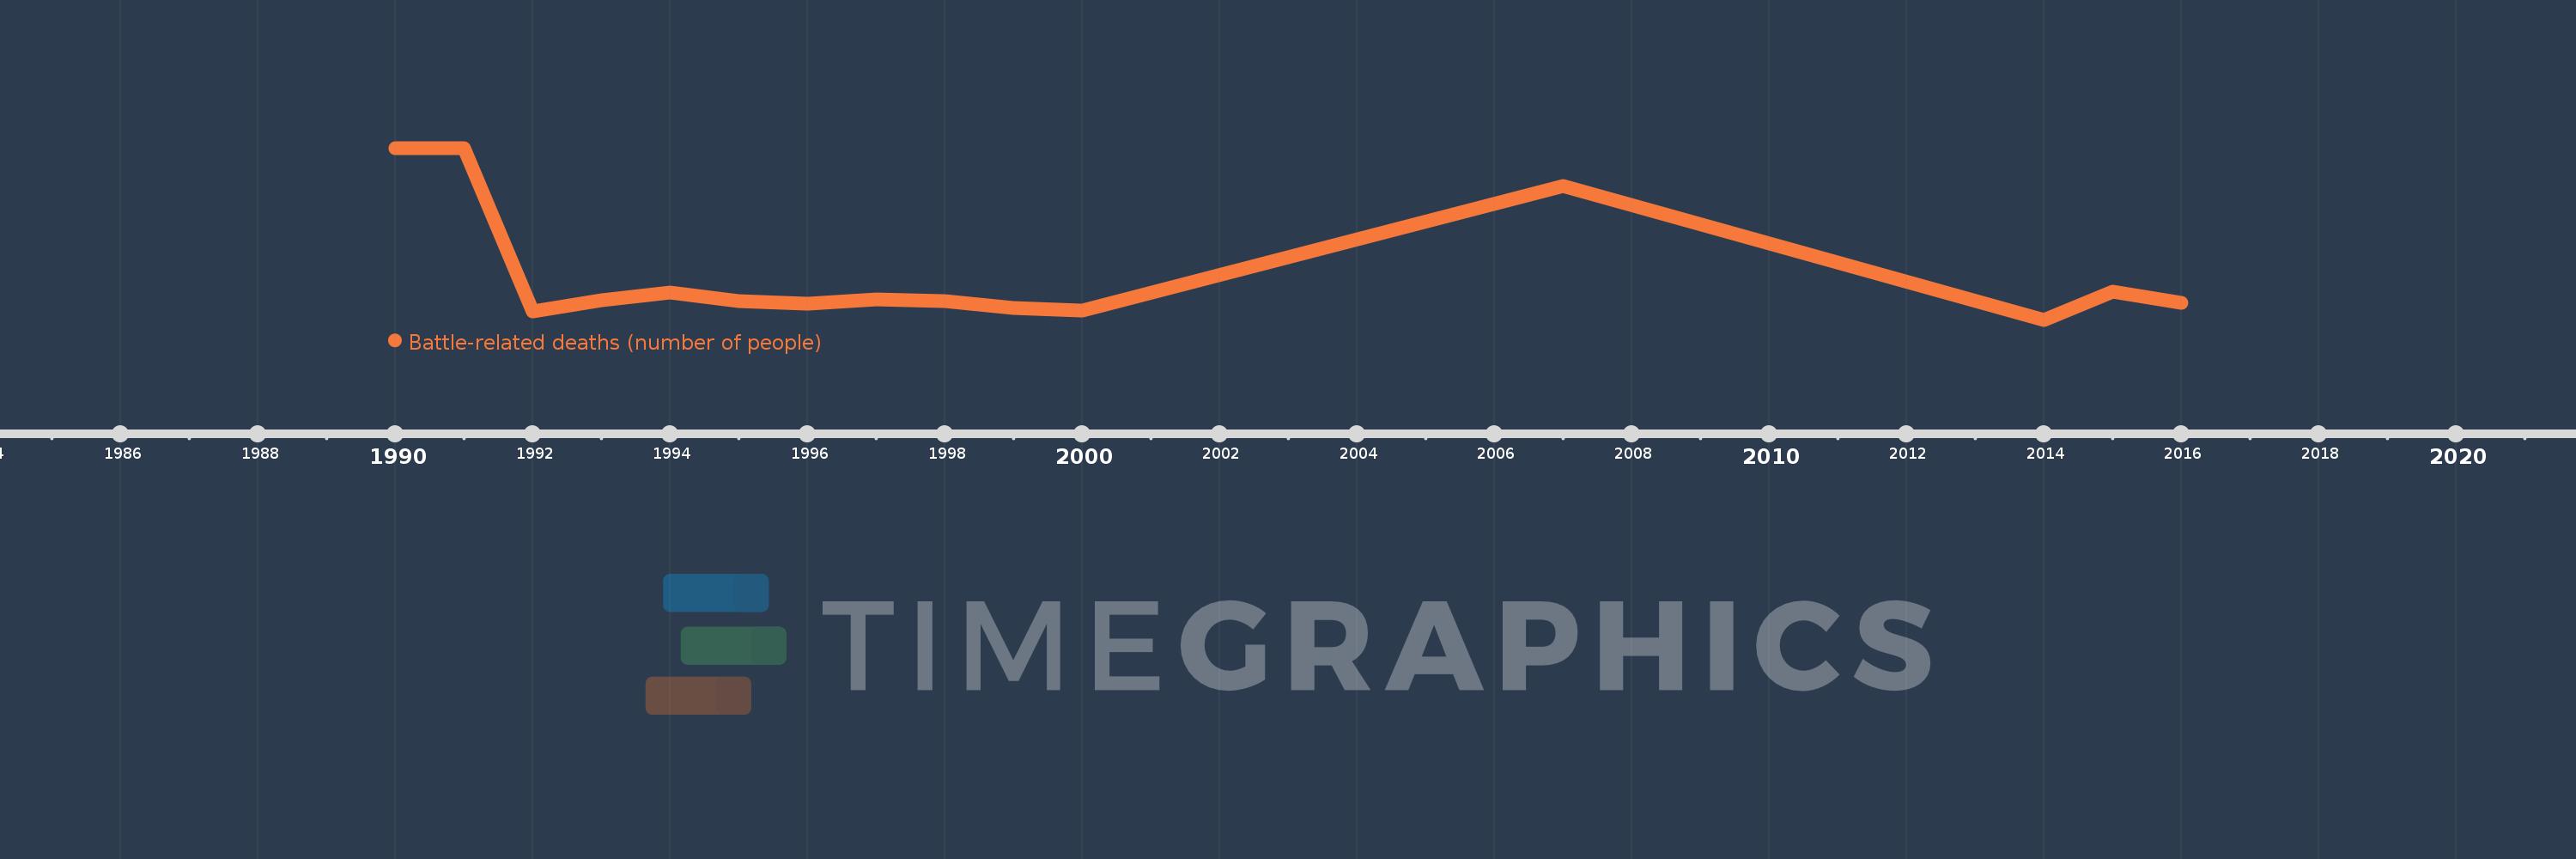
Battle-related deaths (number of people)
2016,2015,2014,2007,2000,1999,1998,1997,1996,1995,1994,1993,1992,1991,1990
This statistics in other country:
Timeline:
This timeline shows a graph from 1990 to 2016 of Lebanon. No data until 1989. Number of actual observations by date: 15.
Source name:
World Development Indicators
Source organization:
Uppsala Conflict Data Program, http://www.pcr.uu.se/research/UCDP/.
Categories, topics:
Public Sector
Last updated:
apr 23, 2017
Indicators value changes by year
At the date of observation
Value
Absolute change
Change from previous value
jan 1, 1990
753.0
+753.0
0.0%
jan 1, 1991
753.0
0.0
0.0%
jan 1, 1992
40.0
-713.0
-94.69%
jan 1, 1993
89.0
+49.0
122.5%
jan 1, 1994
122.0
+33.0
37.08%
jan 1, 1995
82.0
-40.0
-32.79%
jan 1, 1996
73.0
-9.0
-10.98%
jan 1, 1997
90.0
+17.0
23.29%
jan 1, 1998
82.0
-8.0
-8.89%
jan 1, 1999
54.0
-28.0
-34.15%
jan 1, 2000
41.0
-13.0
-24.07%
jan 1, 2007
588.0
+547.0
1.33K%
jan 1, 2014
2.0
-586.0
-99.66%
jan 1, 2015
126.0
+124.0
6.2K%
jan 1, 2016
76.0
-50.0
-39.68%
Ranking of countries by current statistics by years


Comments: