29
/
en
AIzaSyAYiBZKx7MnpbEhh9jyipgxe19OcubqV5w
April 1, 2024
97827
Cabo Verde
CPV
true
2
1
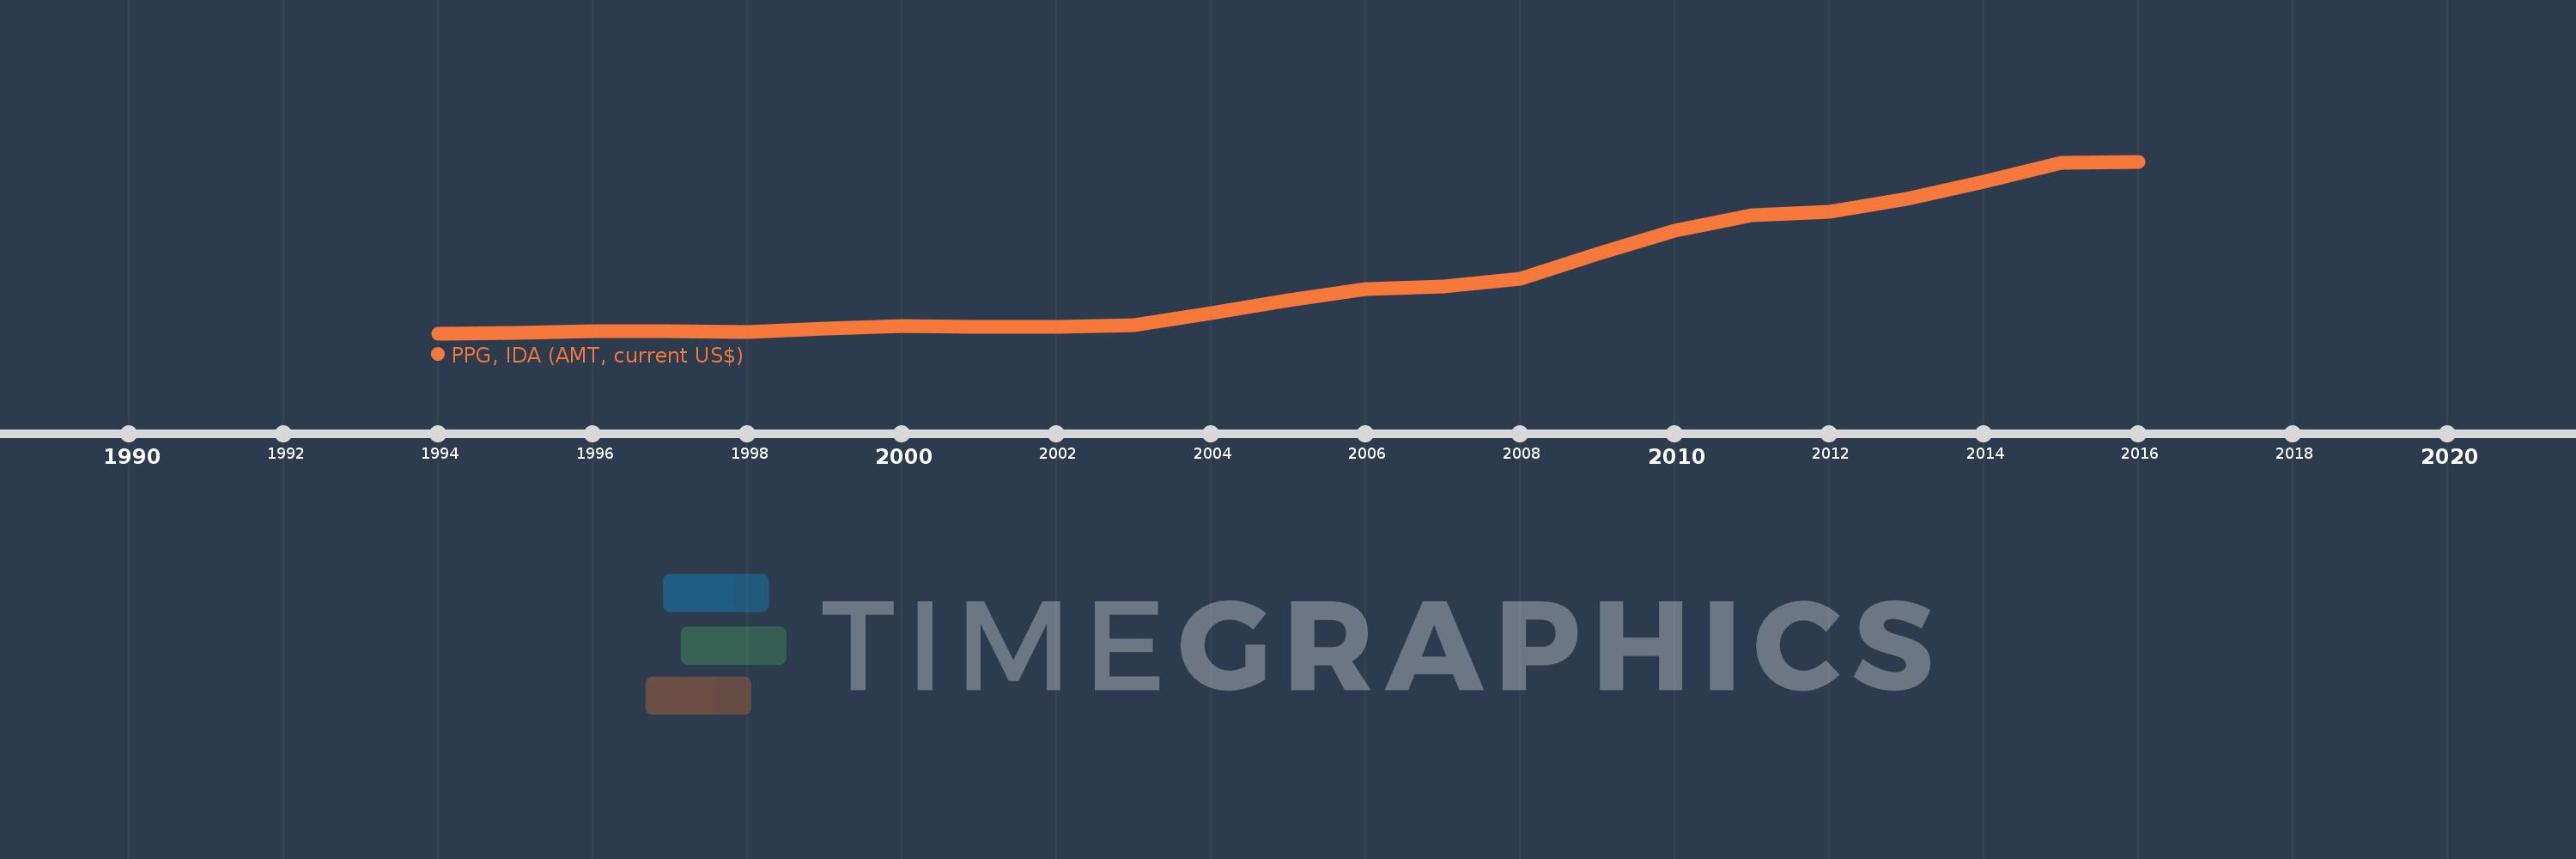
PPG, IDA (AMT, current US$)
2016,2015,2014,2013,2012,2011,2010,2009,2008,2007,2006,2005,2004,2003,2002,2001,2000,1999,1998,1997,1996,1995,1994
This statistics in other country:
Timeline:
This timeline shows a graph from 1994 to 2016 of Cabo Verde. No data until 1993. Number of actual observations by date: 23.
Source name:
World Development Indicators
Source organization:
World Bank, International Debt Statistics.
Categories, topics:
External Debt
Last updated:
apr 23, 2017
Indicators value changes by year
Maximum:
5.438 mln
jan 1, 2016
At the date of observation
Value
Absolute change
Change from previous value
jan 1, 1994
66.0K
+66.0K
0.0%
jan 1, 1995
67.0K
+1000.0
1.52%
jan 1, 1996
132.0K
+65.0K
97.01%
jan 1, 1997
124.0K
-8.0K
-6.06%
jan 1, 1998
117.0K
-7.0K
-5.65%
jan 1, 1999
201.0K
+84.0K
71.79%
jan 1, 2000
289.0K
+88.0K
43.78%
jan 1, 2001
280.0K
-9.0K
-3.11%
jan 1, 2002
271.0K
-9.0K
-3.21%
jan 1, 2003
317.0K
+46.0K
16.97%
jan 1, 2004
692.0K
+375.0K
118.3%
jan 1, 2005
1.094 mln
+402.0K
58.09%
jan 1, 2006
1.437 mln
+343.0K
31.35%
jan 1, 2007
1.538 mln
+101.0K
7.03%
jan 1, 2008
1.775 mln
+237.0K
15.41%
jan 1, 2009
2.561 mln
+786.0K
44.28%
jan 1, 2010
3.267 mln
+706.0K
27.57%
jan 1, 2011
3.749 mln
+482.0K
14.75%
jan 1, 2012
3.855 mln
+106.0K
2.83%
jan 1, 2013
4.262 mln
+407.0K
10.56%
jan 1, 2014
4.797 mln
+535.0K
12.55%
jan 1, 2015
5.397 mln
+600.0K
12.51%
jan 1, 2016
5.438 mln
+41.0K
0.76%
Ranking of countries by current statistics by years


Comments: